Take this as an idea to develop your own setup
Main Items we see on the 4hs Chart:
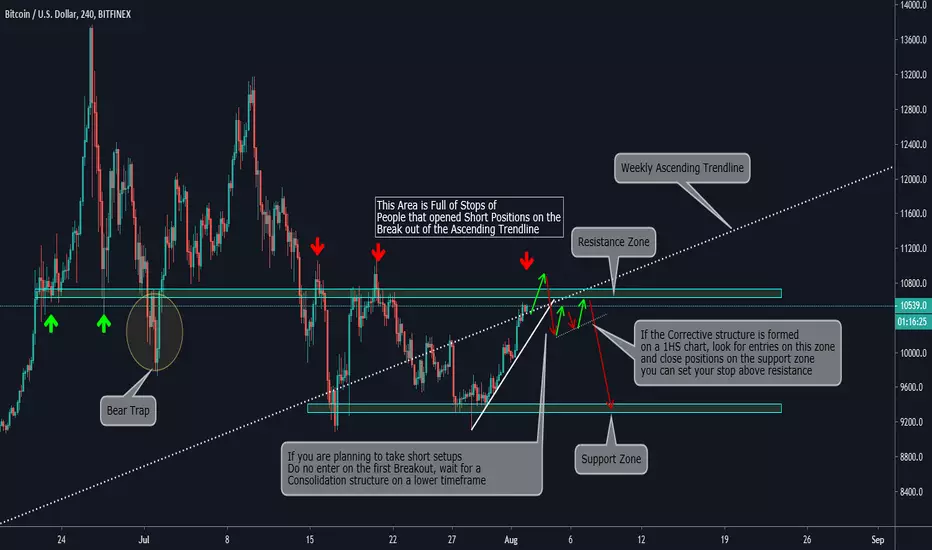
a)Price is Below the Weekly Ascending Trendline (Bearish potential signal)
b)Currently, the price is on a range between a support level and a resistance level
c)Technically our conclusion is that the path of less resistance is a Bearish Movement towards the support zone
d)Our idea to take this movement is:
-First, look for Pin bars or any candlestick that tries to take the stops above the resistance, if that happens and then the price returns to current levels that would be a powerful signal
-Second, Do Not enter on the breakout of the current bullish movement, there is a high risk of a fakeout by doing that
-Third, Wait for the breakout and wait for a corrective structure on a lower timeframe such as 1H or 30MIN, The structure should be at least an ABC
-If this happens you will be taking a confirmed setup, and for sure you will be on the strongest side, then the market will tell us how accurate or not the setup was, always focus on "what depends on you"
Daily Vision:

Weekly Vision:

Main Items we see on the 4hs Chart:
a)Price is Below the Weekly Ascending Trendline (Bearish potential signal)
b)Currently, the price is on a range between a support level and a resistance level
c)Technically our conclusion is that the path of less resistance is a Bearish Movement towards the support zone
d)Our idea to take this movement is:
-First, look for Pin bars or any candlestick that tries to take the stops above the resistance, if that happens and then the price returns to current levels that would be a powerful signal
-Second, Do Not enter on the breakout of the current bullish movement, there is a high risk of a fakeout by doing that
-Third, Wait for the breakout and wait for a corrective structure on a lower timeframe such as 1H or 30MIN, The structure should be at least an ABC
-If this happens you will be taking a confirmed setup, and for sure you will be on the strongest side, then the market will tell us how accurate or not the setup was, always focus on "what depends on you"
Daily Vision:
Weekly Vision:
Ghi chú
By now all the short entries that opened positions on the breakout of the ascending trendline have been stoped, we will wait to see if the price returns back to the support resistance zone and there we will evaluate if the short scenario keeps ongoing or if we have to change our bearish viewBài đăng liên quan
Thông báo miễn trừ trách nhiệm
Thông tin và các ấn phẩm này không nhằm mục đích, và không cấu thành, lời khuyên hoặc khuyến nghị về tài chính, đầu tư, giao dịch hay các loại khác do TradingView cung cấp hoặc xác nhận. Đọc thêm tại Điều khoản Sử dụng.
Thông báo miễn trừ trách nhiệm
Thông tin và các ấn phẩm này không nhằm mục đích, và không cấu thành, lời khuyên hoặc khuyến nghị về tài chính, đầu tư, giao dịch hay các loại khác do TradingView cung cấp hoặc xác nhận. Đọc thêm tại Điều khoản Sử dụng.