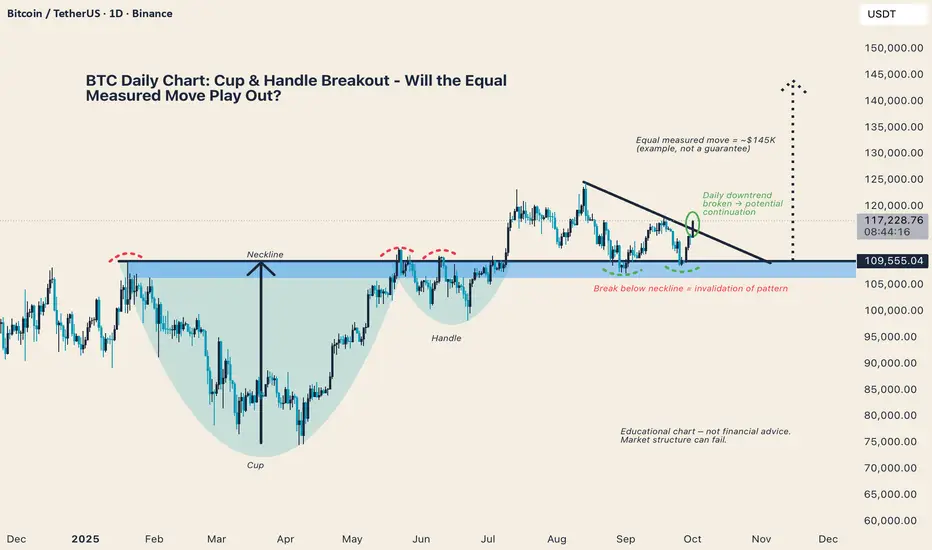
Bitcoin has broken above its daily downtrend while holding above the neckline of a Cup & Handle formation.
Equal Measured Move Example: ~$145K (for educational purposes, not a guarantee)
Key Structure: Sustained closes above the neckline support continuation
Invalidation Level: A decisive break back below the neckline would negate the setup
⚠️ Educational Chart - Market structure can fail. This analysis is for learning purposes only, not financial advice.
What do you think - is this the breakout that pushes BTC into its next leg higher, or will neckline support fail?
Thông báo miễn trừ trách nhiệm
Thông tin và ấn phẩm không có nghĩa là và không cấu thành, tài chính, đầu tư, kinh doanh, hoặc các loại lời khuyên hoặc khuyến nghị khác được cung cấp hoặc xác nhận bởi TradingView. Đọc thêm trong Điều khoản sử dụng.
Thông báo miễn trừ trách nhiệm
Thông tin và ấn phẩm không có nghĩa là và không cấu thành, tài chính, đầu tư, kinh doanh, hoặc các loại lời khuyên hoặc khuyến nghị khác được cung cấp hoặc xác nhận bởi TradingView. Đọc thêm trong Điều khoản sử dụng.