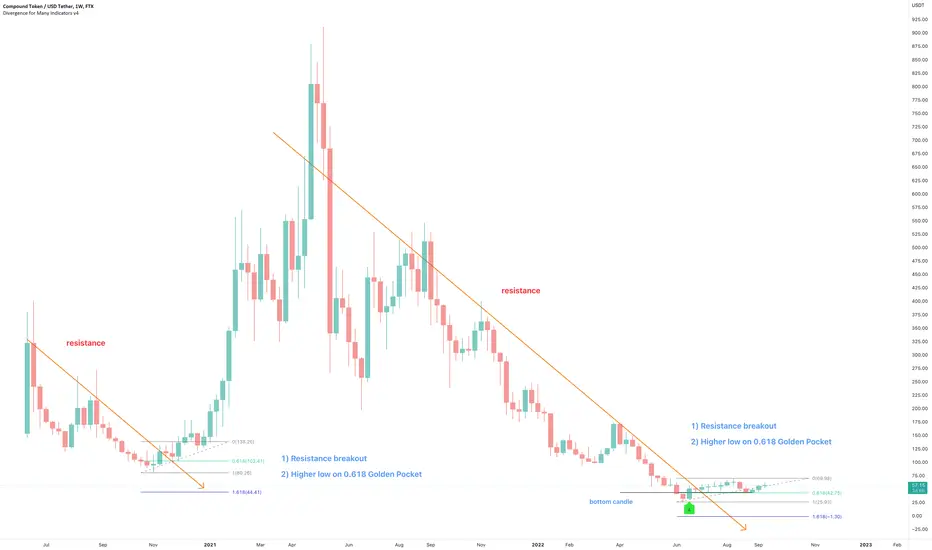
On the above 1-week chart price action has corrected 95% since May 2021. A number of reasons now exist to be bullish, including:
1) A strong buy signal prints (not shown). If you want to see, just ask.
2) Price action, RSI and MFI resistance breakouts.
3) Regular bullish divergence.
4) Everything that was said above is also true for the BTC pair.
5) Price action prints the higher low on the golden pocket following point #2. Look left!
Is it possible price action falls further? Sure.
Is it probable? No.
Ww
Type: trade
Risk: <=6% of portfolio
Timeframe: Don’t know.
Return: $800 / 1400%
Stop loss: None
Ghi chú
Do you see the 2-day DOJI candle printing on the 2-day/50-day SMA?? Closes today.Giao dịch đang hoạt động
Did you see the candle that has printed on the two week chart? Fantastic.What does this candle mean?
youtube.com/watch?v=H3ZBDIsF0is
Ghi chú
This is a 2-day chart. The two moving averages shown (on separate time frames) saw a crazy jump in price action once they crossed. A particular give away is the curved bottom.Let's come back to this place in 90 days to see if history repeated itself.
Giao dịch đang hoạt động
Did you see what printed on the 3-day chart?What happened just at the beginning of this month has not happened since January 7-10th, 2021. Price action roared up 450% after that.
Bài đăng liên quan
Thông báo miễn trừ trách nhiệm
Thông tin và ấn phẩm không có nghĩa là và không cấu thành, tài chính, đầu tư, kinh doanh, hoặc các loại lời khuyên hoặc khuyến nghị khác được cung cấp hoặc xác nhận bởi TradingView. Đọc thêm trong Điều khoản sử dụng.
Bài đăng liên quan
Thông báo miễn trừ trách nhiệm
Thông tin và ấn phẩm không có nghĩa là và không cấu thành, tài chính, đầu tư, kinh doanh, hoặc các loại lời khuyên hoặc khuyến nghị khác được cung cấp hoặc xác nhận bởi TradingView. Đọc thêm trong Điều khoản sử dụng.