Hello Traders,
In this short-term analysis, we will have a look at the German DAX Index.
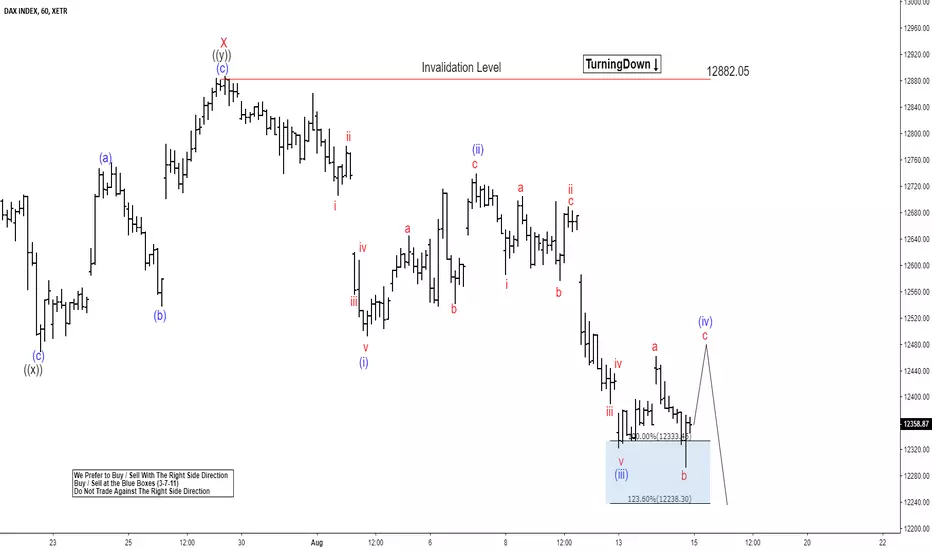
DAX short-term Elliott wave analysis suggests that the rally to 12882.05 high ended red wave X bounce. The internals of that bounce unfolded as Elliott wave double three structure where black wave ((w)) ended at 12640.87. Black wave ((x)) ended at 12468.68 and black wave ((y)) of red X ended at 12882.05 high.
Down from there, DAX is currently suggesting that it is unfolding as a potential 5 waves structure. Where blue wave (i) ended at 02/08/18 low (12491.53), blue wave (ii) pullback at 07/08/18 peak (12740.66), and blue wave (iii) at 08/13/18 low (12321.45). Currently, it is in the progress of making a pullback in blue wave (iv) before extending 1 more leg lower in blue wave (v) before a 3 waves bounce higher can be seen. We don’t like selling it.
In this short-term analysis, we will have a look at the German DAX Index.
DAX short-term Elliott wave analysis suggests that the rally to 12882.05 high ended red wave X bounce. The internals of that bounce unfolded as Elliott wave double three structure where black wave ((w)) ended at 12640.87. Black wave ((x)) ended at 12468.68 and black wave ((y)) of red X ended at 12882.05 high.
Down from there, DAX is currently suggesting that it is unfolding as a potential 5 waves structure. Where blue wave (i) ended at 02/08/18 low (12491.53), blue wave (ii) pullback at 07/08/18 peak (12740.66), and blue wave (iii) at 08/13/18 low (12321.45). Currently, it is in the progress of making a pullback in blue wave (iv) before extending 1 more leg lower in blue wave (v) before a 3 waves bounce higher can be seen. We don’t like selling it.
14 days trial --> elliottwave-forecast.com/plan-trial/ and get Accurate & timely Elliott Wave Forecasts of 78 instruments. Webinars, Chat Room, Stocks/Forex/Indices Signals & more.
Thông báo miễn trừ trách nhiệm
Thông tin và ấn phẩm không có nghĩa là và không cấu thành, tài chính, đầu tư, kinh doanh, hoặc các loại lời khuyên hoặc khuyến nghị khác được cung cấp hoặc xác nhận bởi TradingView. Đọc thêm trong Điều khoản sử dụng.