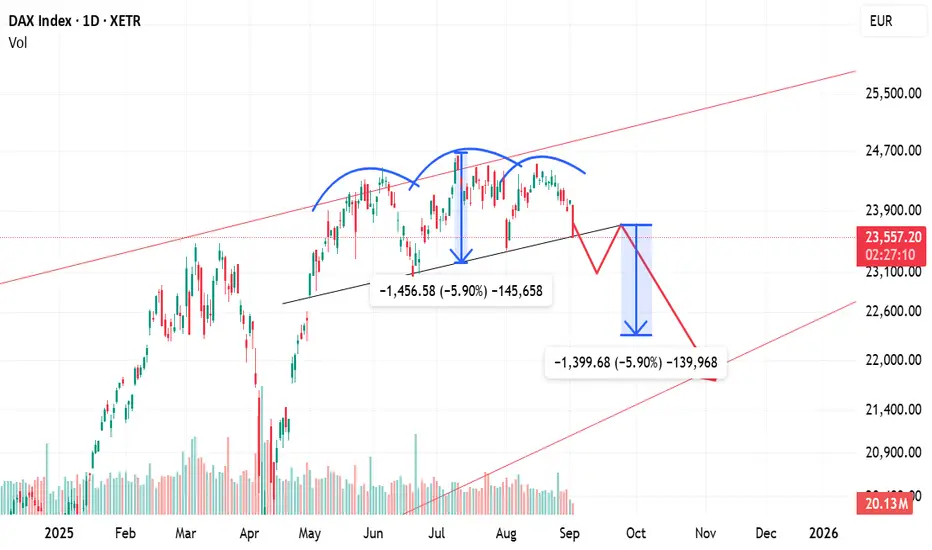
The DAX index is currently forming a Head and Shoulders pattern on the daily chart, a well-known bearish reversal formation. This pattern typically signals a potential shift in trend from bullish to bearish if the breakdown occurs.
Left Shoulder – Formed when prices peaked, followed by a correction.
Head – A higher peak, marking the top of the uptrend, followed by another decline.
Right Shoulder – A lower high compared to the head, showing weakening bullish momentum.
Neckline – The key support line connecting the lows between the shoulders and the head.
⚖️ Implications
If the DAX breaks below the neckline with strong volume, it will confirm the pattern.
This breakdown could trigger further downward momentum, with potential targets calculated by measuring the distance from the head to the neckline and projecting it downward.
✅ Summary
Pattern: Head & Shoulders (bearish) on daily chart.
Trigger: Breakdown below the neckline.
Outcome: Increased probability of further decline, with downside targets extending to lower support zones.
Ghi chú
Still waiting for the breakdownThông báo miễn trừ trách nhiệm
Thông tin và ấn phẩm không có nghĩa là và không cấu thành, tài chính, đầu tư, kinh doanh, hoặc các loại lời khuyên hoặc khuyến nghị khác được cung cấp hoặc xác nhận bởi TradingView. Đọc thêm trong Điều khoản sử dụng.
Thông báo miễn trừ trách nhiệm
Thông tin và ấn phẩm không có nghĩa là và không cấu thành, tài chính, đầu tư, kinh doanh, hoặc các loại lời khuyên hoặc khuyến nghị khác được cung cấp hoặc xác nhận bởi TradingView. Đọc thêm trong Điều khoản sử dụng.