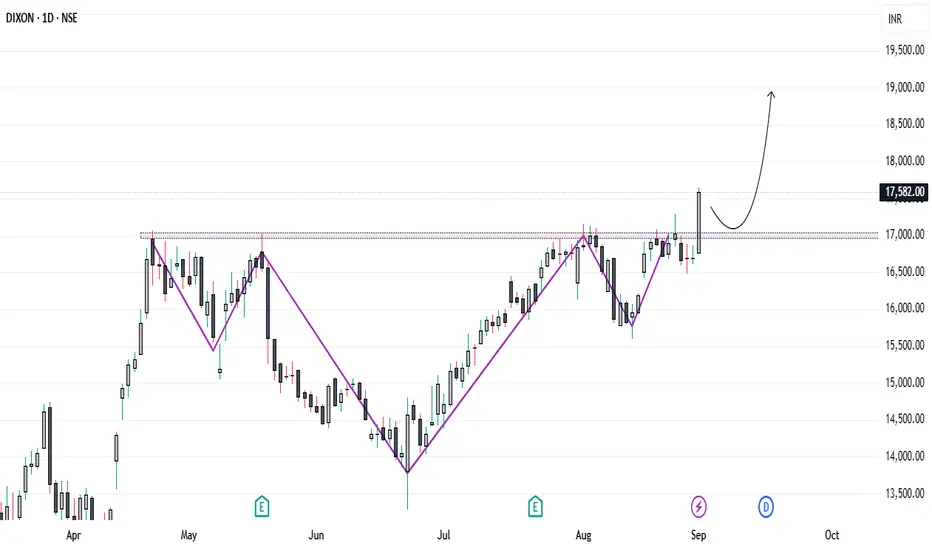
DIXON has been consolidating in a bullish structure over the past few weeks, forming an Inverted Head & Shoulders pattern on the daily timeframe – a strong reversal signal that often precedes major trend shifts.
📈 Technical Breakout:
Today, the stock broke above the ₹17,000 neckline resistance with strong volume and closed 5.3% higher intraday. This breakout candle confirms buyer dominance and signals a potential shift into a sustained uptrend.
🔍 Trade Plan:
* Entry Zone: Look for a retest of ₹17,000 for a safer entry.
* Stop-Loss: ₹16,450 (recent swing low & neckline support).
* Target Levels:
* 🎯 ₹18,200 – Near-term resistance based on recent price action.
* 🎯 ₹19,000 – Next significant supply zone.
* 🎯 ₹20,200+ – Medium-term target based on pattern projection.
🌐 Fundamental Tailwind:
India’s strong GDP growth data has boosted investor confidence, providing a macro push that aligns with DIXON’s bullish breakout. The confluence of technical strength and economic optimism increases the probability of a strong follow-through rally.
📊 Takeaway:
This setup combines a clear breakout, defined risk levels, strong volume confirmation, and positive macro sentiment – an ideal scenario for trend-following traders.
Thông báo miễn trừ trách nhiệm
Thông tin và ấn phẩm không có nghĩa là và không cấu thành, tài chính, đầu tư, kinh doanh, hoặc các loại lời khuyên hoặc khuyến nghị khác được cung cấp hoặc xác nhận bởi TradingView. Đọc thêm trong Điều khoản sử dụng.
Thông báo miễn trừ trách nhiệm
Thông tin và ấn phẩm không có nghĩa là và không cấu thành, tài chính, đầu tư, kinh doanh, hoặc các loại lời khuyên hoặc khuyến nghị khác được cung cấp hoặc xác nhận bởi TradingView. Đọc thêm trong Điều khoản sử dụng.