As of June 6, 2025, Dr. Reddy's Laboratories Ltd. (NSE: DRREDDY) is trading at approximately ₹1,290.60, reflecting a 3.04% increase over the previous day.
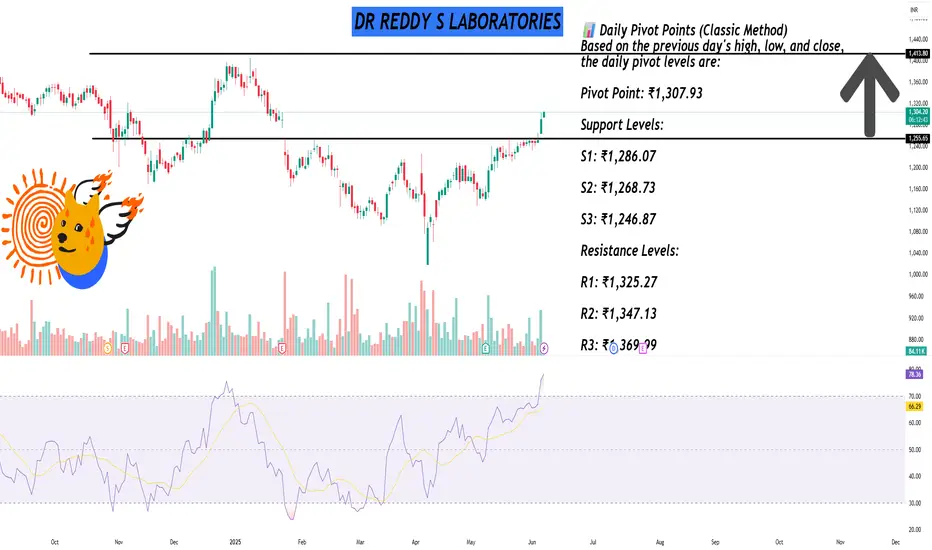
📊 Daily Pivot Points (Classic Method)
Based on the previous day's high, low, and close, the daily pivot levels are:
Pivot Point: ₹1,307.93
Support Levels:
S1: ₹1,286.07
S2: ₹1,268.73
S3: ₹1,246.87
Resistance Levels:
R1: ₹1,325.27
R2: ₹1,347.13
R3: ₹1,369.99
📈 Fibonacci Pivot Points
Using Fibonacci calculations, the levels are:
Pivot Point: ₹1,307.93
Support Levels:
S1: ₹1,286.07
S2: ₹1,268.73
S3: ₹1,246.87
Resistance Levels:
R1: ₹1,325.27
R2: ₹1,347.13
R3: ₹1,369.99
🔍 Camarilla Pivot Points
Derived using the Camarilla method:
Pivot Point: ₹1,286.07
Support Levels:
S1: ₹1,269.04
S2: ₹1,279.82
S3: ₹1,283.41
Resistance Levels:
R1: ₹1,294.19
R2: ₹1,297.79
R3: ₹1,301.38
📌 Trading Insights
Immediate Support: ₹1,286.07 (Classic S1)
Immediate Resistance: ₹1,325.27 (Classic R1)
Traders may consider these levels for setting stop-loss and take-profit orders. A break above ₹1,325.27 could signal bullish momentum, while a drop below ₹1,286.07 might indicate bearish pressure.
I built a Buy & Sell Signal Indicator with 85% accuracy.
📈 Get access via DM or
WhatsApp: wa.link/d997q0
Contact - +91 76782 40962
| Email: techncialexpress@gmail.com
| Script Coder | Trader | Investor | From India
📈 Get access via DM or
WhatsApp: wa.link/d997q0
Contact - +91 76782 40962
| Email: techncialexpress@gmail.com
| Script Coder | Trader | Investor | From India
Bài đăng liên quan
Thông báo miễn trừ trách nhiệm
Thông tin và các ấn phẩm này không nhằm mục đích, và không cấu thành, lời khuyên hoặc khuyến nghị về tài chính, đầu tư, giao dịch hay các loại khác do TradingView cung cấp hoặc xác nhận. Đọc thêm tại Điều khoản Sử dụng.