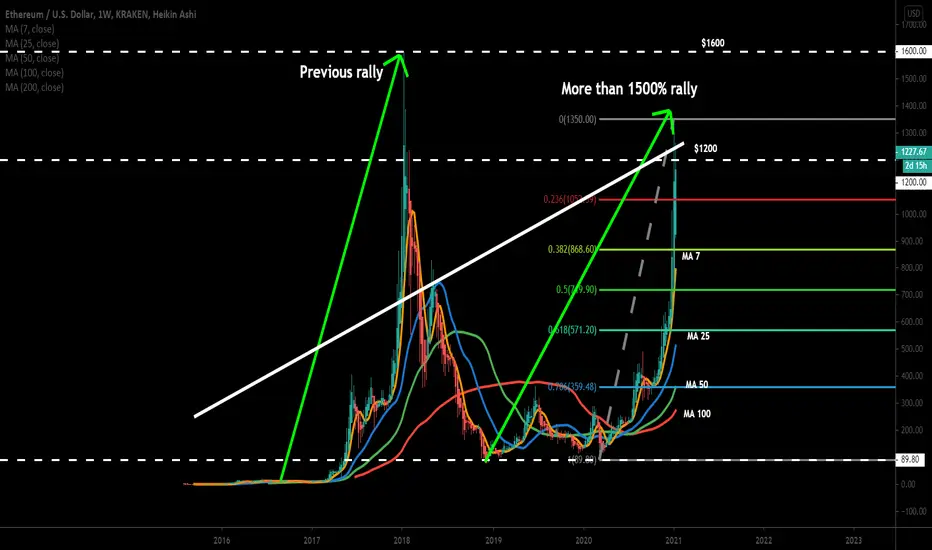
The importance of SMA 7 and 25:
The previous rally of 2017 ended when on the weekly chart, the simple moving average 7 crossed down the SMA 25. This time sofar the price action is retesting, again and again, the SMA 7 and did not break down it sofar.

Critical resistance and Cup & Handle Formation:
On the long-term weekly chart, the price action is in a critical resistance zone which starts from $1200 and ends at $1600. Here the price action has found the resistance of Cup and Handle pattern at $1200. And retraced almost up to 0.382 Fibonacci level to complete the handle of Cup.

Attempting breakout resistance in the Bitcoin market:
On the Ethereum with Bitcoin pair’s weekly chart, the price action of Ethereum has formed a strong uptrend line support. And now trying to break out the 25 simple moving average resistance.

Conclusion:
If the price action will break out the 25 simple moving average resistance in the Bitcoin market. Then it can turn more bullish against Bitcoin and a very strong bull run can be seen in the US Dollar market as well.
For harmonic trading signals join:
patreon.com/moon333
The previous rally of 2017 ended when on the weekly chart, the simple moving average 7 crossed down the SMA 25. This time sofar the price action is retesting, again and again, the SMA 7 and did not break down it sofar.
Critical resistance and Cup & Handle Formation:
On the long-term weekly chart, the price action is in a critical resistance zone which starts from $1200 and ends at $1600. Here the price action has found the resistance of Cup and Handle pattern at $1200. And retraced almost up to 0.382 Fibonacci level to complete the handle of Cup.
Attempting breakout resistance in the Bitcoin market:
On the Ethereum with Bitcoin pair’s weekly chart, the price action of Ethereum has formed a strong uptrend line support. And now trying to break out the 25 simple moving average resistance.
Conclusion:
If the price action will break out the 25 simple moving average resistance in the Bitcoin market. Then it can turn more bullish against Bitcoin and a very strong bull run can be seen in the US Dollar market as well.
For harmonic trading signals join:
patreon.com/moon333
Thông báo miễn trừ trách nhiệm
Thông tin và các ấn phẩm này không nhằm mục đích, và không cấu thành, lời khuyên hoặc khuyến nghị về tài chính, đầu tư, giao dịch hay các loại khác do TradingView cung cấp hoặc xác nhận. Đọc thêm tại Điều khoản Sử dụng.
Thông báo miễn trừ trách nhiệm
Thông tin và các ấn phẩm này không nhằm mục đích, và không cấu thành, lời khuyên hoặc khuyến nghị về tài chính, đầu tư, giao dịch hay các loại khác do TradingView cung cấp hoặc xác nhận. Đọc thêm tại Điều khoản Sử dụng.