ETHUSD 4H Chart Pattern
📌 Target Zone
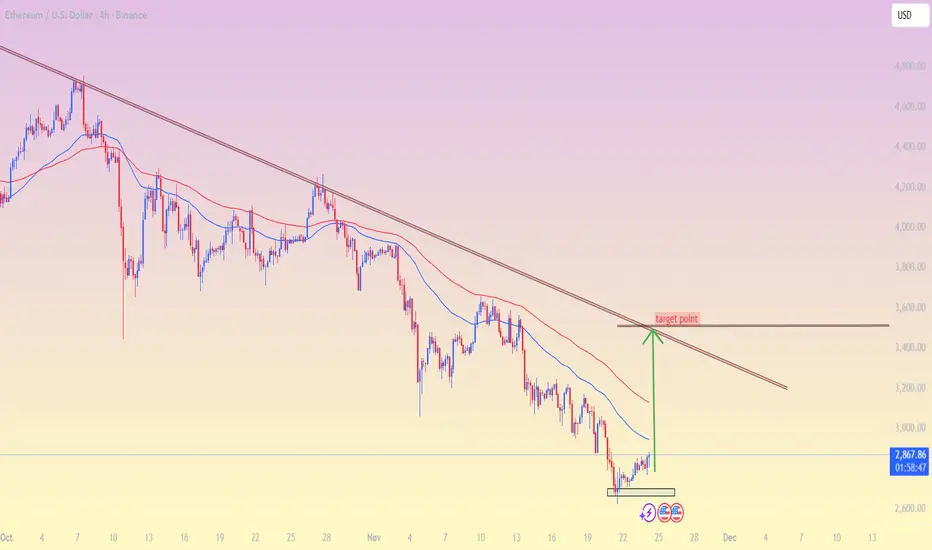
My chart shows price around $2,860 and the trendline resistance sitting roughly around:
➡ Target: $3,450 – $3,550
This zone comes from:
The descending trendline (major resistance)
The level my marked with the green arrow
Previous reaction zone where price last rejected
🔍 Why this target
Price is forming a short-term bottom.
A bounce toward the trendline resistance is reasonable if momentum continues.
That trendline is the next major obstacle for bulls.
⚠ Important
These are technical analysis levels, not financial advice. Always evaluate risk and market conditions.
If my want, I can also give: ✔ Support levels
✔ Breakout target
✔ Stop-loss ideas (educational)
✔ Updated analysis with timeframe my prefer
📌 Target Zone
My chart shows price around $2,860 and the trendline resistance sitting roughly around:
➡ Target: $3,450 – $3,550
This zone comes from:
The descending trendline (major resistance)
The level my marked with the green arrow
Previous reaction zone where price last rejected
🔍 Why this target
Price is forming a short-term bottom.
A bounce toward the trendline resistance is reasonable if momentum continues.
That trendline is the next major obstacle for bulls.
⚠ Important
These are technical analysis levels, not financial advice. Always evaluate risk and market conditions.
If my want, I can also give: ✔ Support levels
✔ Breakout target
✔ Stop-loss ideas (educational)
✔ Updated analysis with timeframe my prefer
Giao dịch đang hoạt động
active active 📲 Join telegram channel free ..
t.me/RSI_Trading_Point4
Forex, Gold & Crypto Signals with detailed analysis & get consistent results..
t.me/XauusdGlobalSignal17
Gold Signal's with proper TP & SL for high profit opportunities..
t.me/RSI_Trading_Point4
Forex, Gold & Crypto Signals with detailed analysis & get consistent results..
t.me/XauusdGlobalSignal17
Gold Signal's with proper TP & SL for high profit opportunities..
Bài đăng liên quan
Thông báo miễn trừ trách nhiệm
Thông tin và các ấn phẩm này không nhằm mục đích, và không cấu thành, lời khuyên hoặc khuyến nghị về tài chính, đầu tư, giao dịch hay các loại khác do TradingView cung cấp hoặc xác nhận. Đọc thêm tại Điều khoản Sử dụng.
📲 Join telegram channel free ..
t.me/RSI_Trading_Point4
Forex, Gold & Crypto Signals with detailed analysis & get consistent results..
t.me/XauusdGlobalSignal17
Gold Signal's with proper TP & SL for high profit opportunities..
t.me/RSI_Trading_Point4
Forex, Gold & Crypto Signals with detailed analysis & get consistent results..
t.me/XauusdGlobalSignal17
Gold Signal's with proper TP & SL for high profit opportunities..
Bài đăng liên quan
Thông báo miễn trừ trách nhiệm
Thông tin và các ấn phẩm này không nhằm mục đích, và không cấu thành, lời khuyên hoặc khuyến nghị về tài chính, đầu tư, giao dịch hay các loại khác do TradingView cung cấp hoặc xác nhận. Đọc thêm tại Điều khoản Sử dụng.