Here’s a simple and comprehensive analysis of CAC 40 Index (FRA40) daily chart 👇
---
🧭 General Market Structure
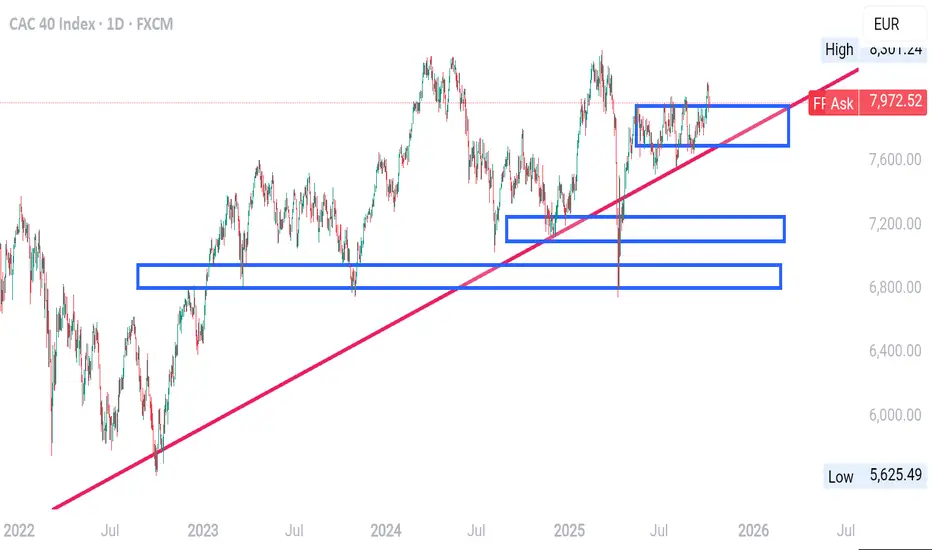
The chart shows a clear long-term uptrend since mid-2022, marked by the ascending red trendline.
This means buyers (institutions) have generally been in control, creating higher lows and higher highs.
---
🔵 Key Institutional Zones
You’ve marked several blue rectangular zones — these are institutional demand zones (buy zones). Let’s break them down:
1. Upper Blue Zone (around 7,800–7,950)
This is the most recent consolidation zone where price has been ranging sideways.
It shows that institutions are accumulating — meaning big players are building positions before deciding the next move.
If price breaks above this zone strongly, it could trigger a bullish continuation toward new highs.
If price falls below the zone, it could signal distribution (a sell-off phase).
2. Middle Blue Zone (around 7,150–7,250)
This was a previous demand area where strong buying pressure entered before.
If the market corrects downward, this zone is the first strong institutional buy zone where buyers may re-enter.
3. Lower Blue Zone (around 6,750–6,900)
This is a major long-term institutional accumulation zone.
It represents deep value — if price ever returns here, it could offer a high-probability long-term buy opportunity.
---
🔺 Trendline Dynamics
The red ascending trendline has been acting as a dynamic support, confirming the bullish structure.
Price is currently sitting right above this trendline, showing that buyers are still defending it.
A break and close below this trendline would be an early warning that momentum is weakening.
---
⚖️ Current Outlook (as of ~7,975 EUR)
The market is at a key resistance near all-time highs.
Two possible outcomes:
1. Bullish scenario — price breaks above 8,000 and sustains: continuation toward new highs.
2. Bearish scenario — price rejects this level, breaks below the red trendline and upper blue zone: correction down to 7,200 or even 6,900 zones.
---
🧠 Simple Summary
Aspect Meaning
Trend Uptrend (bullish bias)
Structure Higher highs/lows intact
Current phase Consolidation near resistance
Key supports 7,200 and 6,800 zones
Key resistance 8,000–8,050 area
Decision point Break above 8,000 → bullish continuation<br>Break below trendline → correction likely
---
🧭 General Market Structure
The chart shows a clear long-term uptrend since mid-2022, marked by the ascending red trendline.
This means buyers (institutions) have generally been in control, creating higher lows and higher highs.
---
🔵 Key Institutional Zones
You’ve marked several blue rectangular zones — these are institutional demand zones (buy zones). Let’s break them down:
1. Upper Blue Zone (around 7,800–7,950)
This is the most recent consolidation zone where price has been ranging sideways.
It shows that institutions are accumulating — meaning big players are building positions before deciding the next move.
If price breaks above this zone strongly, it could trigger a bullish continuation toward new highs.
If price falls below the zone, it could signal distribution (a sell-off phase).
2. Middle Blue Zone (around 7,150–7,250)
This was a previous demand area where strong buying pressure entered before.
If the market corrects downward, this zone is the first strong institutional buy zone where buyers may re-enter.
3. Lower Blue Zone (around 6,750–6,900)
This is a major long-term institutional accumulation zone.
It represents deep value — if price ever returns here, it could offer a high-probability long-term buy opportunity.
---
🔺 Trendline Dynamics
The red ascending trendline has been acting as a dynamic support, confirming the bullish structure.
Price is currently sitting right above this trendline, showing that buyers are still defending it.
A break and close below this trendline would be an early warning that momentum is weakening.
---
⚖️ Current Outlook (as of ~7,975 EUR)
The market is at a key resistance near all-time highs.
Two possible outcomes:
1. Bullish scenario — price breaks above 8,000 and sustains: continuation toward new highs.
2. Bearish scenario — price rejects this level, breaks below the red trendline and upper blue zone: correction down to 7,200 or even 6,900 zones.
---
🧠 Simple Summary
Aspect Meaning
Trend Uptrend (bullish bias)
Structure Higher highs/lows intact
Current phase Consolidation near resistance
Key supports 7,200 and 6,800 zones
Key resistance 8,000–8,050 area
Decision point Break above 8,000 → bullish continuation<br>Break below trendline → correction likely
Thông báo miễn trừ trách nhiệm
Thông tin và ấn phẩm không có nghĩa là và không cấu thành, tài chính, đầu tư, kinh doanh, hoặc các loại lời khuyên hoặc khuyến nghị khác được cung cấp hoặc xác nhận bởi TradingView. Đọc thêm trong Điều khoản sử dụng.
Thông báo miễn trừ trách nhiệm
Thông tin và ấn phẩm không có nghĩa là và không cấu thành, tài chính, đầu tư, kinh doanh, hoặc các loại lời khuyên hoặc khuyến nghị khác được cung cấp hoặc xác nhận bởi TradingView. Đọc thêm trong Điều khoản sử dụng.