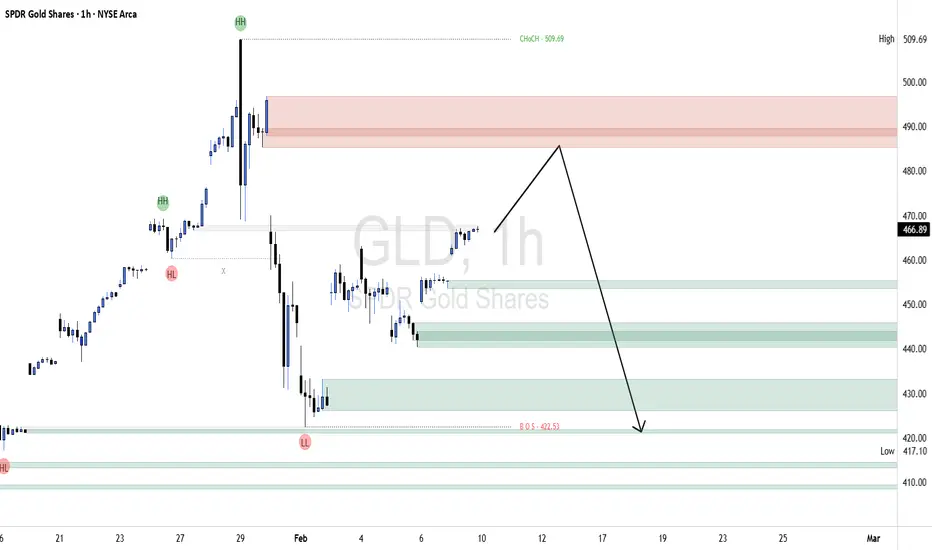
Broader Market Structure
GLD was previously in a clear bullish structure, printing higher highs and higher lows into late January. That bullish phase culminated with a higher high near 509.69, which is explicitly marked as a Change of Character (CHoCH) level. Price failed to sustain above that high and reversed sharply, indicating buyers lost control. The subsequent selloff broke below the prior higher low and ultimately led to a Break of Structure (BOS) at 422.53, confirming a shift back to a bearish market structure. This BOS suggests the prior uptrend has fully transitioned into bearish continuation rather than a shallow pullback.
Supply and Demand Zones
The supply zone between roughly 485–495 is strong. Price dropped sharply from this area with large bearish candles and little hesitation, showing aggressive selling pressure and minimal buyer response. Each attempt to move higher since then has stalled well below this zone, reinforcing its validity.
On the downside, the demand zone around 440–455 shows moderate strength. Buyers stepped in here previously and managed to slow the decline, producing a bounce, but the reaction was corrective and lacked strong bullish follow-through. The lower demand near 420–425 is more significant, as price based briefly before the most recent impulsive leg higher, making it a key downside target if selling resumes.
Price Action in the Marked Region
In the highlighted region, price is currently pushing upward from the mid-450s toward overhead supply. The advance is choppy and overlapping, suggesting corrective price action rather than impulsive buying. Price is approaching the lower boundary of supply but has not shown acceptance above it. This behavior favors a rejection from supply, followed by a rotation back down toward the 445–440 demand zone, with continuation risk toward the 422 area if that support fails.
Trade Bias, Expectation, and Invalidation
The current trade bias is bearish. The expected direction is a pullback from supply and continuation lower into demand.
The key invalidation level is a sustained break and hold above 495, which would indicate acceptance above supply and force a reassessment of bearish continuation.
Momentum and Candle Behavior
Momentum currently favors sellers. The recent push higher lacks strong bullish expansion and shows smaller-bodied candles into resistance, consistent with distribution. There are no strong bullish continuation patterns present; instead, price behavior aligns with a corrective retracement within a broader downtrend.
Looking for powerful AI trading signals? Visit ProSignal.ai and take your trading to the next level! or join our telegram channel at t.me/prosignalai
Discord: discord.gg/qQmChQYG
Discord: discord.gg/qQmChQYG
Thông báo miễn trừ trách nhiệm
Thông tin và các ấn phẩm này không nhằm mục đích, và không cấu thành, lời khuyên hoặc khuyến nghị về tài chính, đầu tư, giao dịch hay các loại khác do TradingView cung cấp hoặc xác nhận. Đọc thêm tại Điều khoản Sử dụng.