🏦 HDFC – Trade Setup & Key Levels 📊
Analyzing HDFC on current chart structure with clear entry, exit, stop loss, support, and resistance zones.
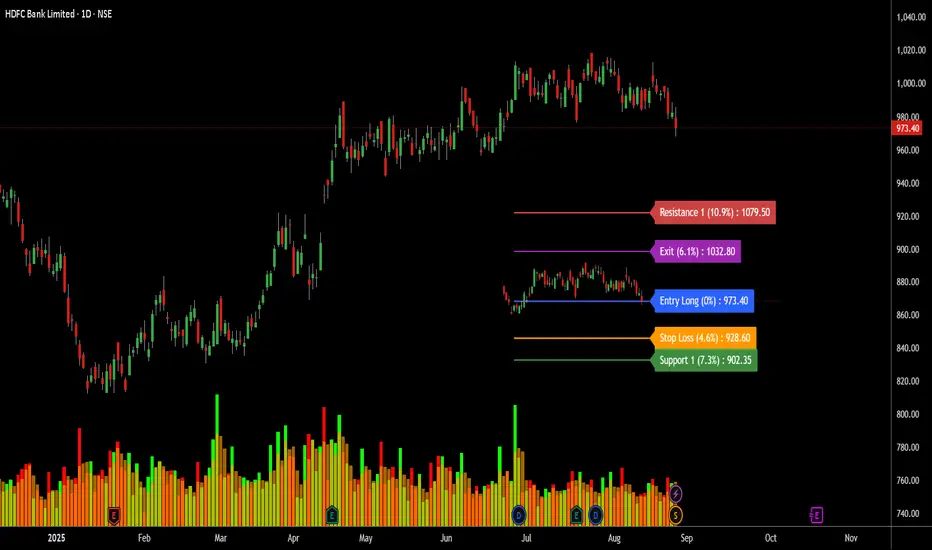
📌 **Entry Price (Long):** 973.40
🔑 Key Levels to Watch:
🔹 **Exit Target:** +6.1% → 1032.80
🔹 **Stop Loss:** -4.6% → 928.60
🔹 **Support Zone:** -7.3% → 902.35
🔹 **Resistance Zone:** +10.9% → 1079.50
Pine Script®
🔔 **Be sure to follow updated ideas for HDFC!** 🔔
⏰ **Timeframe:** Daily & 4H chart-based analysis.
⚖️ **Always apply a Stop Loss** to protect capital.
💡 **This is just my trading idea — follow your own strategy.**
✅ Don’t forget to hit the 'Like' ✅ 🙏😊 & Share with fellow traders if this setup helps!
Analyzing HDFC on current chart structure with clear entry, exit, stop loss, support, and resistance zones.
📌 **Entry Price (Long):** 973.40
🔑 Key Levels to Watch:
🔹 **Exit Target:** +6.1% → 1032.80
🔹 **Stop Loss:** -4.6% → 928.60
🔹 **Support Zone:** -7.3% → 902.35
🔹 **Resistance Zone:** +10.9% → 1079.50
HDFC is trading close to its support area. Entry is positioned at 973.40, with a favorable risk-to-reward ratio targeting 1032.80 first. Resistance remains higher at 1079.50, while downside risk is capped by the stop loss at 928.60.
- **Bullish View:** If momentum sustains above 973.40, price can aim for 1032.80 and later 1079.50.
- **Bearish View:** Breakdown below 928.60 may drag price lower toward 902.35 support.
⚠️ **Note:** If 928.60 breaks, expect further downside risk. ⚠️
🔔 **Be sure to follow updated ideas for HDFC!** 🔔
⏰ **Timeframe:** Daily & 4H chart-based analysis.
⚖️ **Always apply a Stop Loss** to protect capital.
💡 **This is just my trading idea — follow your own strategy.**
✅ Don’t forget to hit the 'Like' ✅ 🙏😊 & Share with fellow traders if this setup helps!
🌳Indicator: bit.ly/2DJVXDn 💚
🦄telegram: 🟢 t.me/longbuylongsellindicator 🟢
✔️contact: t.me/wealthworldmajic
🎯web: no.com
🟠twitter : twitter.com/marxcbabu 💲
youtube.com/@marxcbabu/videos
🦄telegram: 🟢 t.me/longbuylongsellindicator 🟢
✔️contact: t.me/wealthworldmajic
🎯web: no.com
🟠twitter : twitter.com/marxcbabu 💲
youtube.com/@marxcbabu/videos
Thông báo miễn trừ trách nhiệm
Thông tin và các ấn phẩm này không nhằm mục đích, và không cấu thành, lời khuyên hoặc khuyến nghị về tài chính, đầu tư, giao dịch hay các loại khác do TradingView cung cấp hoặc xác nhận. Đọc thêm tại Điều khoản Sử dụng.