📉 Technical Indicators
Relative Strength Index (RSI): Approximately 35.08, indicating the stock is nearing oversold conditions but not yet in the oversold zone.
Moving Average Convergence Divergence (MACD): Around -6.02, suggesting a bearish trend.
Moving Averages:
5-day EMA: ₹957.70 (Sell)
10-day EMA: ₹963.20 (Sell)
20-day EMA: ₹961.06 (Sell)
50-day EMA: ₹981.06 (Sell)
100-day EMA: ₹974.24 (Sell)
200-day EMA: ₹921.92 (Buy)
The short-term moving averages are indicating sell signals, while the long-term 200-day EMA is showing a buy signal.
Pivot Points:
Support Levels: ₹929.82 (S3), ₹936.53 (S2), ₹943.52 (S1)
Resistance Levels: ₹957.22 (R1), ₹963.93 (R2), ₹970.92 (R3)
These levels can help identify potential price reversal points.
📊 Price Action
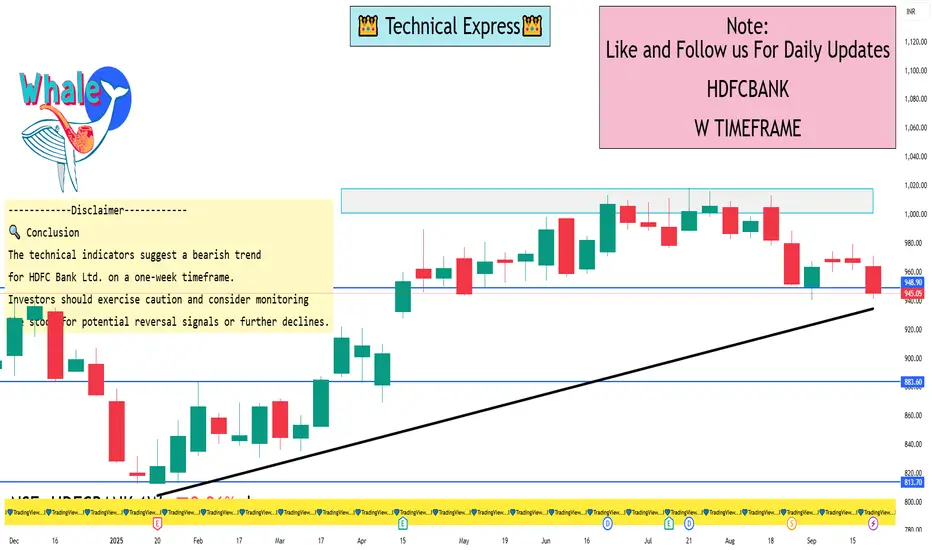
The stock closed at ₹945.05 on September 26, 2025, marking a 0.51% decline from the previous close. Over the past week, the share price has decreased by 2.26%.
⚠️ Recent Developments
HDFC Bank is currently facing regulatory challenges, including a ban by the Dubai Financial Services Authority from accepting new clients or initiating new business activities through its branch at the Dubai International Financial Centre. This could impact investor sentiment and the bank's international operations.
🔍 Conclusion
The technical indicators suggest a bearish trend for HDFC Bank Ltd. on a one-week timeframe. Investors should exercise caution and consider monitoring the stock for potential reversal signals or further declines.
Relative Strength Index (RSI): Approximately 35.08, indicating the stock is nearing oversold conditions but not yet in the oversold zone.
Moving Average Convergence Divergence (MACD): Around -6.02, suggesting a bearish trend.
Moving Averages:
5-day EMA: ₹957.70 (Sell)
10-day EMA: ₹963.20 (Sell)
20-day EMA: ₹961.06 (Sell)
50-day EMA: ₹981.06 (Sell)
100-day EMA: ₹974.24 (Sell)
200-day EMA: ₹921.92 (Buy)
The short-term moving averages are indicating sell signals, while the long-term 200-day EMA is showing a buy signal.
Pivot Points:
Support Levels: ₹929.82 (S3), ₹936.53 (S2), ₹943.52 (S1)
Resistance Levels: ₹957.22 (R1), ₹963.93 (R2), ₹970.92 (R3)
These levels can help identify potential price reversal points.
📊 Price Action
The stock closed at ₹945.05 on September 26, 2025, marking a 0.51% decline from the previous close. Over the past week, the share price has decreased by 2.26%.
⚠️ Recent Developments
HDFC Bank is currently facing regulatory challenges, including a ban by the Dubai Financial Services Authority from accepting new clients or initiating new business activities through its branch at the Dubai International Financial Centre. This could impact investor sentiment and the bank's international operations.
🔍 Conclusion
The technical indicators suggest a bearish trend for HDFC Bank Ltd. on a one-week timeframe. Investors should exercise caution and consider monitoring the stock for potential reversal signals or further declines.
I built a Buy & Sell Signal Indicator with 85% accuracy.
📈 Get access via DM or
WhatsApp: wa.link/d997q0
Contact - +91 76782 40962
| Email: techncialexpress@gmail.com
| Script Coder | Trader | Investor | From India
📈 Get access via DM or
WhatsApp: wa.link/d997q0
Contact - +91 76782 40962
| Email: techncialexpress@gmail.com
| Script Coder | Trader | Investor | From India
Bài đăng liên quan
Thông báo miễn trừ trách nhiệm
Thông tin và các ấn phẩm này không nhằm mục đích, và không cấu thành, lời khuyên hoặc khuyến nghị về tài chính, đầu tư, giao dịch hay các loại khác do TradingView cung cấp hoặc xác nhận. Đọc thêm tại Điều khoản Sử dụng.