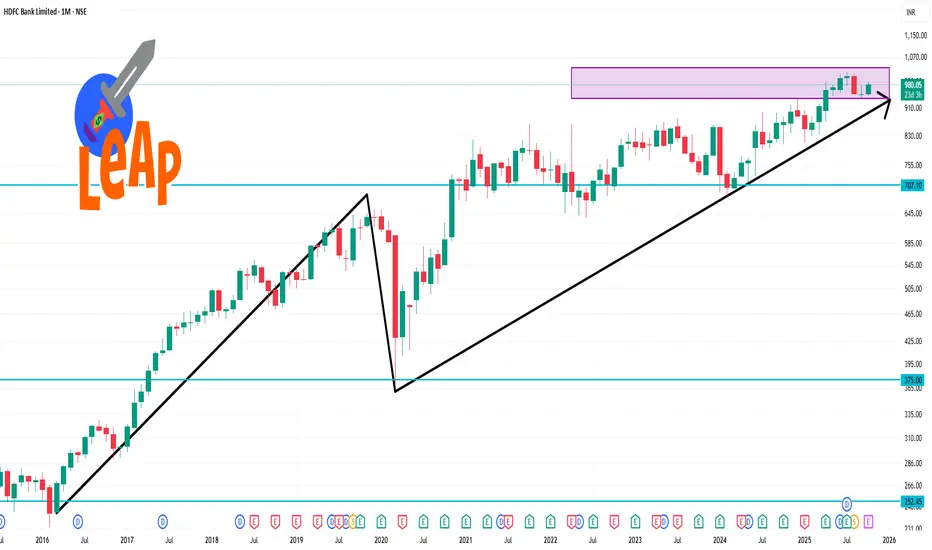
📊 1-Month Technical Outlook
Technical Rating: Strong Buy
Pivot Points:
Classic: Pivot: ₹960.28 | Support: ₹937.03, ₹951.12 | Resistance: ₹974.37, ₹983.53, ₹997.62
Fibonacci: Pivot: ₹960.28 | Support: ₹945.91, ₹951.40 | Resistance: ₹974.65, ₹983.53
Camarilla: Pivot: ₹961.30 | Support: ₹961.09, ₹963.80 | Resistance: ₹967.85, ₹969.21
Moving Averages:
Short-Term (MA5, MA10, MA20): Buy
Medium-Term (MA50): Sell
Long-Term (MA100, MA200): Buy
Relative Strength Index (RSI): 50.54 (Neutral)
MACD: -4.82 (Sell)
Average True Range (ATR): 13.27 (Moderate Volatility)
ADX (Trend Strength): 19.12 (Weak Trend)
Williams %R: -36.70 (Buy)
Commodity Channel Index (CCI): -13.66 (Neutral)
Rate of Change (ROC): -0.22 (Sell)
🔍 Summary
HDFC Bank's stock shows a bullish trend over the past month, with positive technical indicators and a strong buy signal. However, the neutral RSI and sell signal from the MACD suggest caution. Investors should monitor these indicators closely for potential shifts in market sentiment.
Bài đăng liên quan
Thông báo miễn trừ trách nhiệm
Thông tin và ấn phẩm không có nghĩa là và không cấu thành, tài chính, đầu tư, kinh doanh, hoặc các loại lời khuyên hoặc khuyến nghị khác được cung cấp hoặc xác nhận bởi TradingView. Đọc thêm trong Điều khoản sử dụng.
Bài đăng liên quan
Thông báo miễn trừ trách nhiệm
Thông tin và ấn phẩm không có nghĩa là và không cấu thành, tài chính, đầu tư, kinh doanh, hoặc các loại lời khuyên hoặc khuyến nghị khác được cung cấp hoặc xác nhận bởi TradingView. Đọc thêm trong Điều khoản sử dụng.