📊 Daily Snapshot
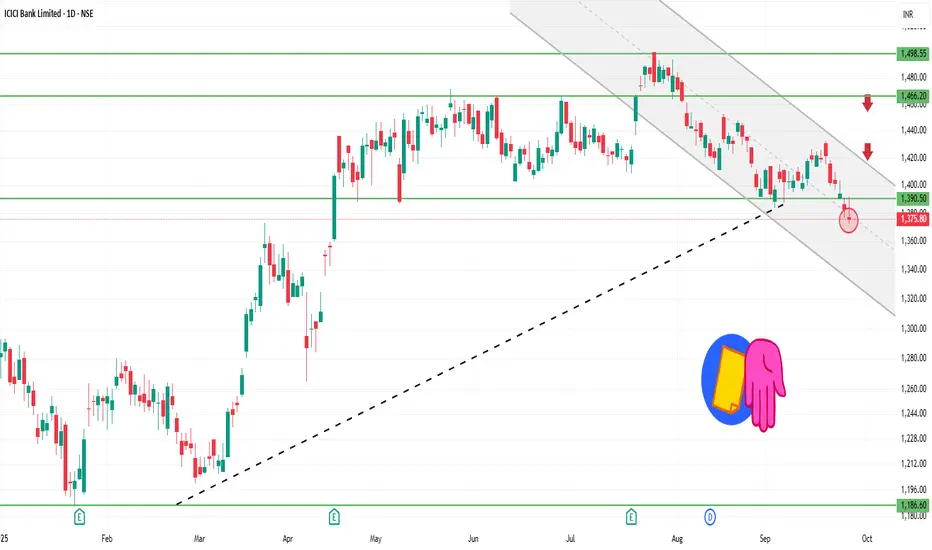
Closing Price: ₹1,375.50
Day’s Range: ₹1,371.80 – ₹1,391.50
Previous Close: ₹1,382.70
Change: Down –0.52%
52-Week Range: ₹1,018.85 – ₹1,494.10
Market Cap: ₹9.7 lakh crore
P/E Ratio: 20.5
Dividend Yield: 1.2%
EPS (TTM): ₹67.00
Beta: 1.05 (moderate volatility)
🔑 Key Technical Levels
Support Zone: ₹1,370 – ₹1,375
Resistance Zone: ₹1,390 – ₹1,400
All-Time High: ₹1,494.10
📈 Technical Indicators
RSI (14-day): 34.1 – approaching oversold territory, suggesting potential for a rebound.
MACD: Negative, indicating bearish momentum.
Moving Averages: Trading below the 150-day moving average, indicating a bearish trend.
Candlestick Patterns: Recent formation of a Bearish Engulfing pattern, suggesting potential for further downside.
📉 Market Sentiment
Recent Performance: ICICI Bank has experienced a decline for the fifth consecutive session, underperforming the broader market.
Sector Performance: The NIFTY BANK index also closed lower, reflecting sector-wide weakness.
📈 Strategy (1D Timeframe)
1. Bullish Scenario
Entry: Above ₹1,390
Stop-Loss: ₹1,370
Target: ₹1,405 → ₹1,420
2. Bearish Scenario
Entry: Below ₹1,370
Stop-Loss: ₹1,390
Target: ₹1,355 → ₹1,340
Bài đăng liên quan
Thông báo miễn trừ trách nhiệm
Thông tin và ấn phẩm không có nghĩa là và không cấu thành, tài chính, đầu tư, kinh doanh, hoặc các loại lời khuyên hoặc khuyến nghị khác được cung cấp hoặc xác nhận bởi TradingView. Đọc thêm trong Điều khoản sử dụng.
Bài đăng liên quan
Thông báo miễn trừ trách nhiệm
Thông tin và ấn phẩm không có nghĩa là và không cấu thành, tài chính, đầu tư, kinh doanh, hoặc các loại lời khuyên hoặc khuyến nghị khác được cung cấp hoặc xác nhận bởi TradingView. Đọc thêm trong Điều khoản sử dụng.