ICICIPRULI – Hidden Pattern Unlocked! Reversal or Continuation?
ICICIPRULI Pattern Reveal
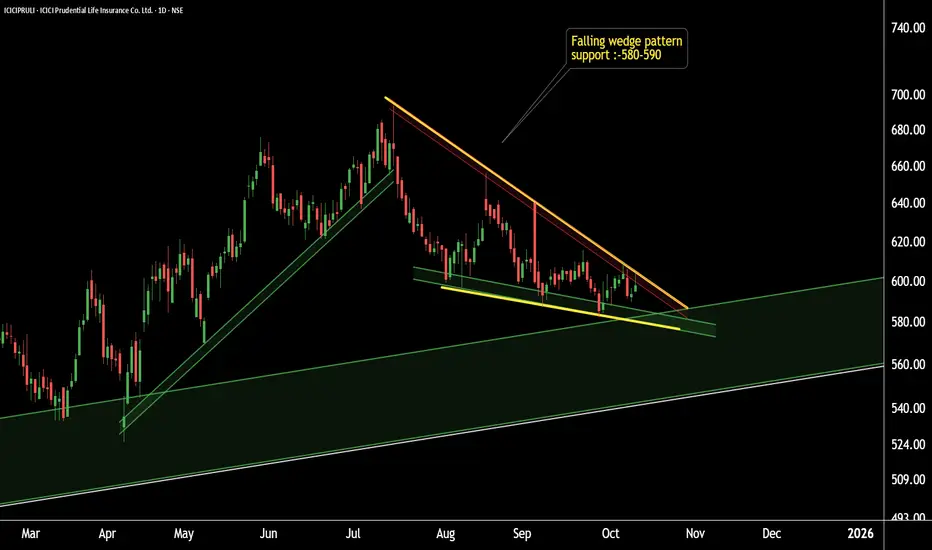
This is the daily timeframe chart of ICICIPRULI.
The stock is forming a falling wedge pattern, which is a bullish reversal setup.
Currently, ICICIPRULI is holding strong support near the 580–590 zone based on pattern structure.
If this level sustains, we may see higher prices in the coming sessions.
Thank You !!
@RahulSaraoge
Connect us at t.me/stridesadvisory
Connect us at t.me/stridesadvisory
Thông báo miễn trừ trách nhiệm
Thông tin và các ấn phẩm này không nhằm mục đích, và không cấu thành, lời khuyên hoặc khuyến nghị về tài chính, đầu tư, giao dịch hay các loại khác do TradingView cung cấp hoặc xác nhận. Đọc thêm tại Điều khoản Sử dụng.