INTC Weekly – Long-Term Accumulation with 5-Year Target
Intel (INTC) has been through a major downtrend since its 2021 peak, but the weekly chart suggests we may have found a structural bottom.
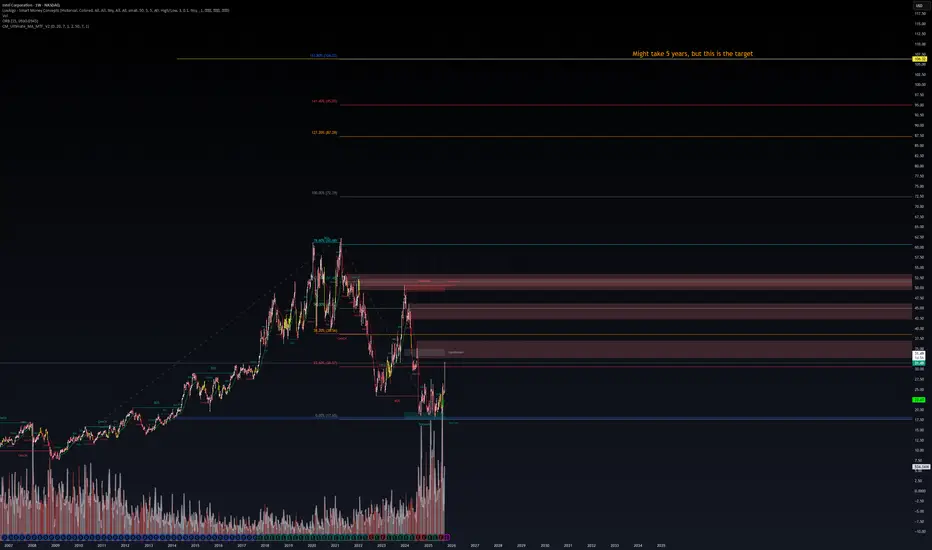
🔑 Key Levels
Support Zone: $27 (recent bottom), $23 major long-term floor.
Resistance: $40–42 (key breakout zone).
Upside Targets (Fibonacci Extensions):
$52–55 → prior supply zone.
$72 → full retracement of 2021 highs.
$87–90 → 127% extension.
$105–110 → 161% extension.
$119 → ultimate 5-year target.
📊 Technical Notes
Price bounced strongly from the 0.786 retracement near $27 with heavy accumulation volume.
Breakout above $40 could confirm a long-term reversal.
Risk remains if support at $27 fails → next major level is $23.
🎯 Outlook
This might take years, but the long-term structure favors accumulation. INTC is positioning to benefit from AI, chip manufacturing expansion, and U.S. semiconductor subsidies.
Bias: Accumulation in the $27–32 range, with long-term targets $72 → $119.
Intel (INTC) has been through a major downtrend since its 2021 peak, but the weekly chart suggests we may have found a structural bottom.
🔑 Key Levels
Support Zone: $27 (recent bottom), $23 major long-term floor.
Resistance: $40–42 (key breakout zone).
Upside Targets (Fibonacci Extensions):
$52–55 → prior supply zone.
$72 → full retracement of 2021 highs.
$87–90 → 127% extension.
$105–110 → 161% extension.
$119 → ultimate 5-year target.
📊 Technical Notes
Price bounced strongly from the 0.786 retracement near $27 with heavy accumulation volume.
Breakout above $40 could confirm a long-term reversal.
Risk remains if support at $27 fails → next major level is $23.
🎯 Outlook
This might take years, but the long-term structure favors accumulation. INTC is positioning to benefit from AI, chip manufacturing expansion, and U.S. semiconductor subsidies.
Bias: Accumulation in the $27–32 range, with long-term targets $72 → $119.
WaverVanir ⚡ To grow and conquer
stocktwits.com/WaverVanir | wavervanir.com | buymeacoffee.com/wavervanir
Not Investment Advice
stocktwits.com/WaverVanir | wavervanir.com | buymeacoffee.com/wavervanir
Not Investment Advice
Thông báo miễn trừ trách nhiệm
The information and publications are not meant to be, and do not constitute, financial, investment, trading, or other types of advice or recommendations supplied or endorsed by TradingView. Read more in the Terms of Use.