Executive Summary
ITC’s financial performance for Q4 FY25 and the full fiscal year demonstrates operational stability in its core businesses, with headline profits influenced by exceptional, non-recurring gains. The company continues to manage challenging market conditions with marginal improvement in recurring profits and robust dividends for shareholders.
Key Financial Highlights
Q4 FY25:
FY25 (Full Year)
Chart Technical Understanding
Disclaimer: lnkd.in/gJJDnvn2
ITC’s financial performance for Q4 FY25 and the full fiscal year demonstrates operational stability in its core businesses, with headline profits influenced by exceptional, non-recurring gains. The company continues to manage challenging market conditions with marginal improvement in recurring profits and robust dividends for shareholders.
Key Financial Highlights
Q4 FY25:
- Gross Revenue: ₹18,266 crore (up 9.2% YoY)
- EBITDA: ₹5,986 crore (up 2.5% YoY)
- Profit Before Tax (PBT): ₹6,417 crore (up 2.1% YoY)
- Profit After Tax (PAT): ₹4,875 crore (up 0.8% YoY)
- Headline Net Profit: ₹19,561.57 crore (reflects one-time exceptional gain, not recurring profit)
FY25 (Full Year)
- Gross Revenue: ₹73,465 crore (up 10.2% YoY)
- PAT: ₹20,092 crore (up 0.9% YoY)
- Dividend: Final dividend of ₹7.85/share for FY25, bringing total annual dividend to ₹14.35/share.
- Analysts view ITC’s core business as resilient under tough conditions, with “modest” organic profit growth.
- Strong cash flows and consistent dividends make ITC an attractive pick for risk-averse, long-term investors.
- The demerger of the hotel business is expected to sharpen management focus and potentially enable better growth performance in future periods.
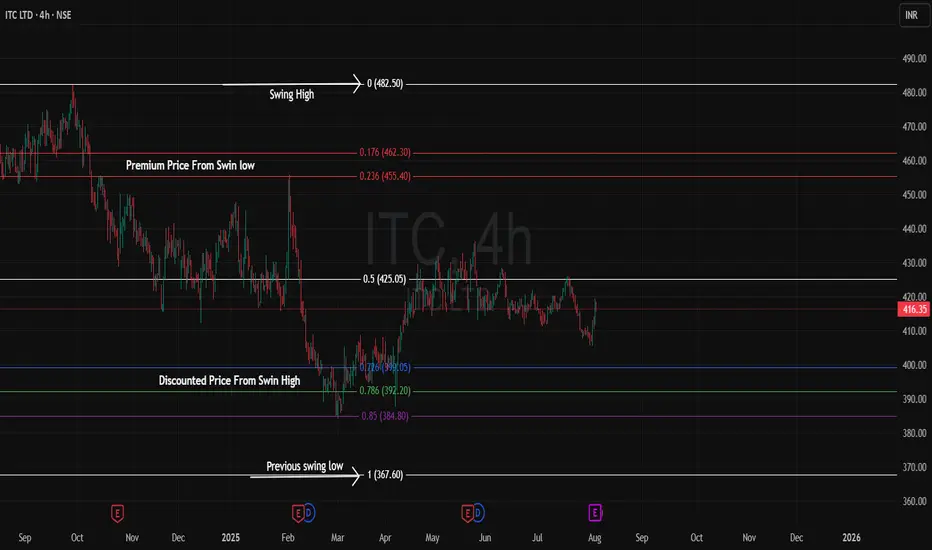
Chart Technical Understanding
- The Fibonacci retracement tool is applied from the recent swing high to the swing low (in a downtrend), or from swing low to swing high (in an uptrend).
- The area from 0% to 50% (below midpoint) signals discount, and 50% to 100% (above midpoint) signals premium.
- If price falls deeply from its swing high, you can quantify how much is discounted by seeing how far below the 50% line it is.
- If price rallies back above the 50% level after retracing, it enters the premium area, indicating the asset is again priced at a premium relative to its prior correction.
Disclaimer: lnkd.in/gJJDnvn2
Thông báo miễn trừ trách nhiệm
Thông tin và ấn phẩm không có nghĩa là và không cấu thành, tài chính, đầu tư, kinh doanh, hoặc các loại lời khuyên hoặc khuyến nghị khác được cung cấp hoặc xác nhận bởi TradingView. Đọc thêm trong Điều khoản sử dụng.
Thông báo miễn trừ trách nhiệm
Thông tin và ấn phẩm không có nghĩa là và không cấu thành, tài chính, đầu tư, kinh doanh, hoặc các loại lời khuyên hoặc khuyến nghị khác được cung cấp hoặc xác nhận bởi TradingView. Đọc thêm trong Điều khoản sử dụng.