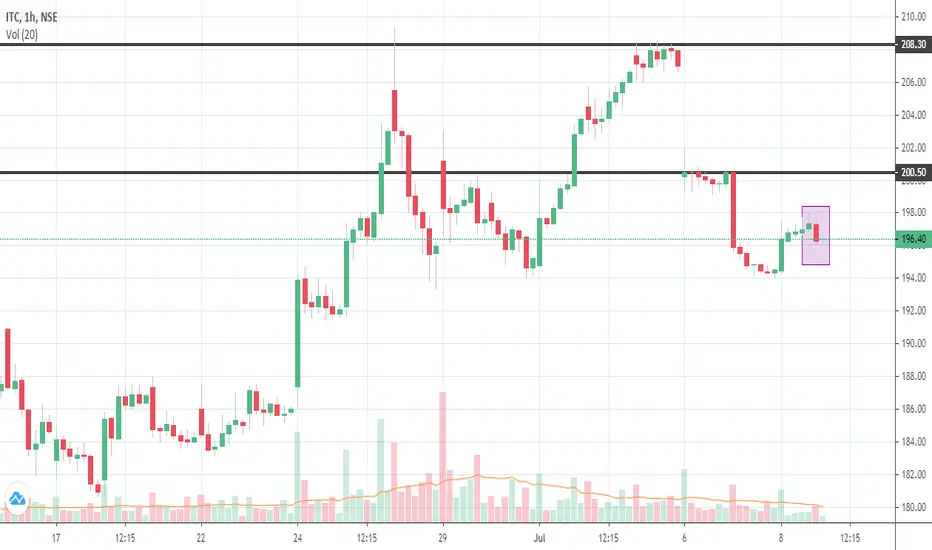
In this one hour chart its quit clearly especially the highlighted part that a inverted hammer on the upside trend resulted in long black candle followed by a doji. For people who dont understand Long black candle + doji combination it is as follows :
"After a decline or long black candlestick, a doji indicates that selling pressure may be diminishing and the downtrend could be nearing an end. Even though the bears are starting to lose control of the decline, further strength is required to confirm any reversal. Bullish confirmation could come from a gap up, long white candlestick or advance above the long black candlestick's open. After a long black candlestick and doji, traders should be on the alert for a potential morning doji star."
.
Overall perspective is that downside is arrested and we might see a move towards the first resistance marked by black line in 1-2 trading session max followed by another try towards 208. Any fall below 191 would render this analysis redundant.
Disclaimer : Please analyze before deciding to trade based on above. My view is for merely understanding purpose
Giao dịch đang hoạt động
No gap up and gap down business..Whatever was lost during the day was recovered in last 45 mins of the trade,making 194.36 levels as the nearest support.People who have entered position in F&O may decide to square it off if tomorrow the above sl is breached as a flat market would result in time decay for call option on monday. People in cash may hold it longer
Giao dịch đang hoạt động
another day of inaction but good volumes. It respected the near time support very well. going ahead with keeping sl the target is still reachableGiao dịch được đóng thủ công
Hit 200 on 15th july.Thông báo miễn trừ trách nhiệm
Thông tin và ấn phẩm không có nghĩa là và không cấu thành, tài chính, đầu tư, kinh doanh, hoặc các loại lời khuyên hoặc khuyến nghị khác được cung cấp hoặc xác nhận bởi TradingView. Đọc thêm trong Điều khoản sử dụng.
Thông báo miễn trừ trách nhiệm
Thông tin và ấn phẩm không có nghĩa là và không cấu thành, tài chính, đầu tư, kinh doanh, hoặc các loại lời khuyên hoặc khuyến nghị khác được cung cấp hoặc xác nhận bởi TradingView. Đọc thêm trong Điều khoản sử dụng.