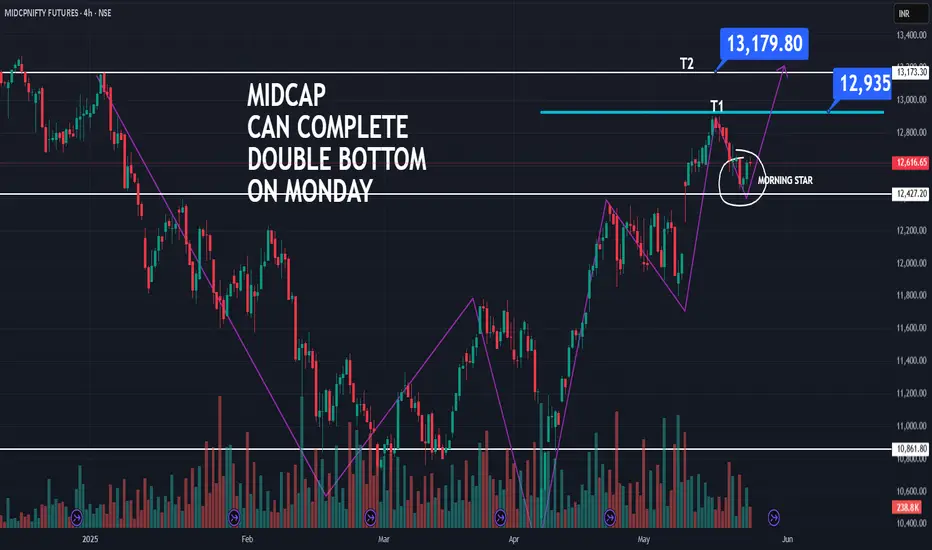
A double bottom pattern is a classic technical analysis charting formation that represents a major change in trend and a momentum reversal from a prior down move in market trading. It describes the drop of a security or index, a rebound, another drop to the same or similar level as the original drop, and finally another rebound (that may become a new uptrend). The double bottom looks like the letter "W." The twice-touched low is now considered a significant support level. While those two lows hold, the upside has new potential.
1
Rivkin Securities. "Technical Analysis: Double Bottom Patterns."
In terms of profit targets, a conservative reading of the pattern suggests the minimum-move price target is equal to the distance of the two lows and the intermediate high. More aggressive targets are double the distance between the two lows and the intermediate high.
Thông báo miễn trừ trách nhiệm
Thông tin và các ấn phẩm này không nhằm mục đích, và không cấu thành, lời khuyên hoặc khuyến nghị về tài chính, đầu tư, giao dịch hay các loại khác do TradingView cung cấp hoặc xác nhận. Đọc thêm tại Điều khoản Sử dụng.
Thông báo miễn trừ trách nhiệm
Thông tin và các ấn phẩm này không nhằm mục đích, và không cấu thành, lời khuyên hoặc khuyến nghị về tài chính, đầu tư, giao dịch hay các loại khác do TradingView cung cấp hoặc xác nhận. Đọc thêm tại Điều khoản Sử dụng.