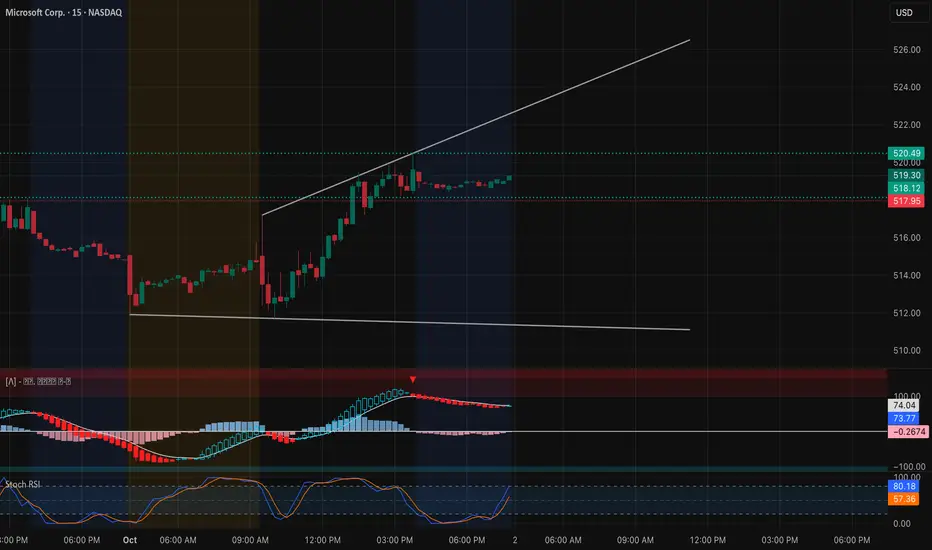
Intraday (15-Min Chart)
Microsoft extended its rally into the $519–$520 zone, where it’s consolidating after a strong push. On the 15-min chart, the trendline remains supportive, but momentum is starting to flatten. MACD is rolling sideways, and Stoch RSI shows MSFT is cooling after overbought readings earlier in the session.
* Immediate support: $518.1 intraday pivot, then $515.9 for trendline support.
* Upside trigger: A breakout above $520.5 could fuel a run toward 522–525.
* Downside risk: Break below $515 risks a pullback toward 511.7–510, where buyers likely defend.
Bias intraday: constructive above 515, but the $520 wall is proving sticky — momentum traders need a clean break.
Options / GEX (1-Hour Chart)

Gamma positioning highlights where the next move could emerge:
* Call walls: Clustered at 522.5 and 525, with a heavy stack at 525 acting as the gamma ceiling.
* Put walls: Strong at 510, deeper at 505 and 500, outlining the risk floor.
* Sentiment: Options flow isn’t overly bullish (only ~10% calls), showing weaker speculative appetite compared to TSLA/PLTR.
This suggests MSFT could remain range-bound if it fails to clear 520. A breakout through 522.5–525 would shift hedging dynamics bullish and potentially unlock 530–535 as upside targets. Conversely, rejection here pulls MSFT back toward 510–505.
My Thoughts
For Oct 2, MSFT is coiling at resistance. Intraday plays favor long scalps above 515 targeting 522–525. For options traders, the clean play is a 520/525 call spread, defined risk into the gamma ceiling. If weakness emerges under 515, hedges with short puts toward 510 provide protection.
Bias: Bullish leaning, but the real breakout requires 522.5+. Until then, MSFT likely chops between 515–520.
Disclaimer: This analysis is for educational purposes only and does not constitute financial advice. Always do your own research and manage risk before trading.
Microsoft extended its rally into the $519–$520 zone, where it’s consolidating after a strong push. On the 15-min chart, the trendline remains supportive, but momentum is starting to flatten. MACD is rolling sideways, and Stoch RSI shows MSFT is cooling after overbought readings earlier in the session.
* Immediate support: $518.1 intraday pivot, then $515.9 for trendline support.
* Upside trigger: A breakout above $520.5 could fuel a run toward 522–525.
* Downside risk: Break below $515 risks a pullback toward 511.7–510, where buyers likely defend.
Bias intraday: constructive above 515, but the $520 wall is proving sticky — momentum traders need a clean break.
Options / GEX (1-Hour Chart)
Gamma positioning highlights where the next move could emerge:
* Call walls: Clustered at 522.5 and 525, with a heavy stack at 525 acting as the gamma ceiling.
* Put walls: Strong at 510, deeper at 505 and 500, outlining the risk floor.
* Sentiment: Options flow isn’t overly bullish (only ~10% calls), showing weaker speculative appetite compared to TSLA/PLTR.
This suggests MSFT could remain range-bound if it fails to clear 520. A breakout through 522.5–525 would shift hedging dynamics bullish and potentially unlock 530–535 as upside targets. Conversely, rejection here pulls MSFT back toward 510–505.
My Thoughts
For Oct 2, MSFT is coiling at resistance. Intraday plays favor long scalps above 515 targeting 522–525. For options traders, the clean play is a 520/525 call spread, defined risk into the gamma ceiling. If weakness emerges under 515, hedges with short puts toward 510 provide protection.
Bias: Bullish leaning, but the real breakout requires 522.5+. Until then, MSFT likely chops between 515–520.
Disclaimer: This analysis is for educational purposes only and does not constitute financial advice. Always do your own research and manage risk before trading.
Thông báo miễn trừ trách nhiệm
Thông tin và các ấn phẩm này không nhằm mục đích, và không cấu thành, lời khuyên hoặc khuyến nghị về tài chính, đầu tư, giao dịch hay các loại khác do TradingView cung cấp hoặc xác nhận. Đọc thêm tại Điều khoản Sử dụng.
Thông báo miễn trừ trách nhiệm
Thông tin và các ấn phẩm này không nhằm mục đích, và không cấu thành, lời khuyên hoặc khuyến nghị về tài chính, đầu tư, giao dịch hay các loại khác do TradingView cung cấp hoặc xác nhận. Đọc thêm tại Điều khoản Sử dụng.