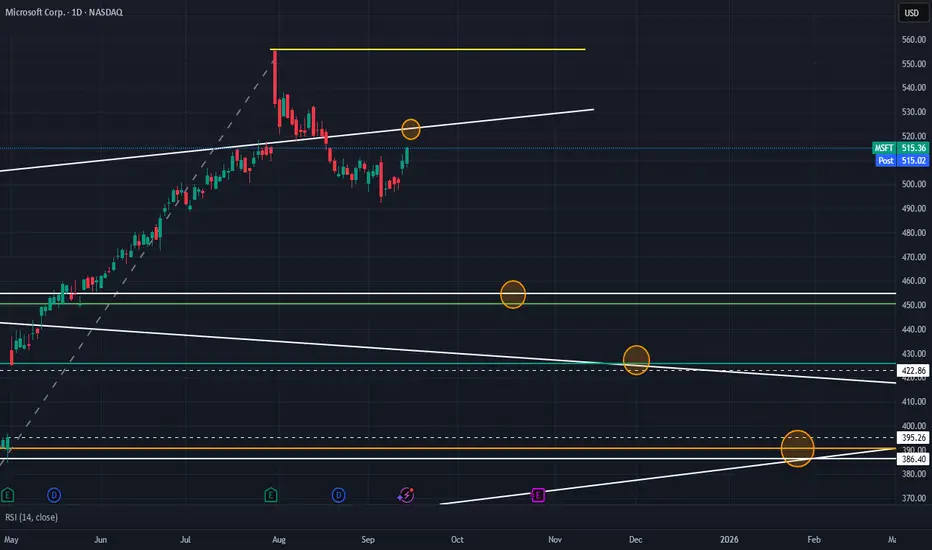
MSFT made a high on 31/07/2025 at 555 which turned out to be a big bearish engulfing candle. Chart pierced above a long term trendline at 515 to touch 555 and then formed a bull trap and continued its downward journey. Since then, price has been making Lower Highs and Lower Lows. Although it’s still just above SMA50.
In the short term, price is likely to kiss a trendline at 522 to 525 before heading downwards.
The question is where would I be a buyer?
I would inch in to buy for a swing trade at three levels:
- my first buy would be at around 450 to 455. This is strong support zone with previous pivot highs hitting this zone. This is also a Fib retracement level of 50%
- my second buy would be 425. This a support level, driven from a trendline which has acted as resistance for previous 3 pivot highs. This is also a Fib retracement level of 61.8% at 425.80. There is a gap fill at 422.86 as well
- my third buy would be between 395 and 386. This is a strong support level and a confluence of a long term trendline that dates to 2023. There is gap fill at 395.26 and Fib retracement level of 78.6% at 390.75
If stock market really had a strong dump, then my buy level for hodl/long term would be around 320. There is a trendline at this level that dates to 2019.
Alternatively, my thesis will be invalid if MSFT close above 555.50.
Thông báo miễn trừ trách nhiệm
Thông tin và ấn phẩm không có nghĩa là và không cấu thành, tài chính, đầu tư, kinh doanh, hoặc các loại lời khuyên hoặc khuyến nghị khác được cung cấp hoặc xác nhận bởi TradingView. Đọc thêm trong Điều khoản sử dụng.
Thông báo miễn trừ trách nhiệm
Thông tin và ấn phẩm không có nghĩa là và không cấu thành, tài chính, đầu tư, kinh doanh, hoặc các loại lời khuyên hoặc khuyến nghị khác được cung cấp hoặc xác nhận bởi TradingView. Đọc thêm trong Điều khoản sử dụng.