WaverVanir International LLC – VolanX Macro/Technical Outlook
Microsoft (
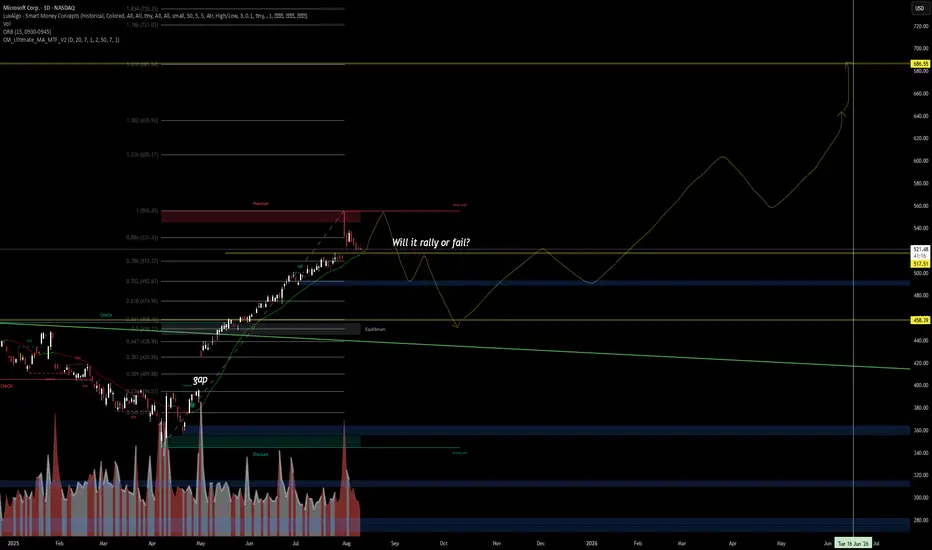
Technical Highlights:
Price currently hovering around $521, with immediate support at $517.51.
Fibonacci retracement levels show potential retrace targets at $492 (0.702) and $458 (Equilibrium Zone).
Previous market structure shift (CHoCH) remains intact — bulls still control the macro trend.
Gap from April remains a historical liquidity zone.
Volume analysis shows tapering interest post-peak, signaling possible short-term weakness.
VolanX Scenario Projections:
Bullish Case: Strong defense at $517–$500, leading to a wave structure breakout towards $686.55 by mid-2026.
Bearish Case: Failure to hold $500 could drive a liquidity sweep toward $458 before a possible long-term continuation higher.
Macro View:
While fundamentals remain strong, the broader NASDAQ environment and AI sector momentum will dictate if Microsoft can rally without retesting deeper supports. Watch for liquidity grabs in discount zones as potential institutional entries.
📊 VolanX Bias: Neutral-Bullish, but we remain patient for an optimal risk-entry confirmation.
Disclaimer: This is not financial advice. For educational purposes only. VolanX models are probabilistic, not predictive.
WaverVanir ⚡ To grow and conquer
stocktwits.com/WaverVanir | wavervanir.com | buymeacoffee.com/wavervanir
Not Investment Advice
stocktwits.com/WaverVanir | wavervanir.com | buymeacoffee.com/wavervanir
Not Investment Advice
Thông báo miễn trừ trách nhiệm
Thông tin và các ấn phẩm này không nhằm mục đích, và không cấu thành, lời khuyên hoặc khuyến nghị về tài chính, đầu tư, giao dịch hay các loại khác do TradingView cung cấp hoặc xác nhận. Đọc thêm tại Điều khoản Sử dụng.