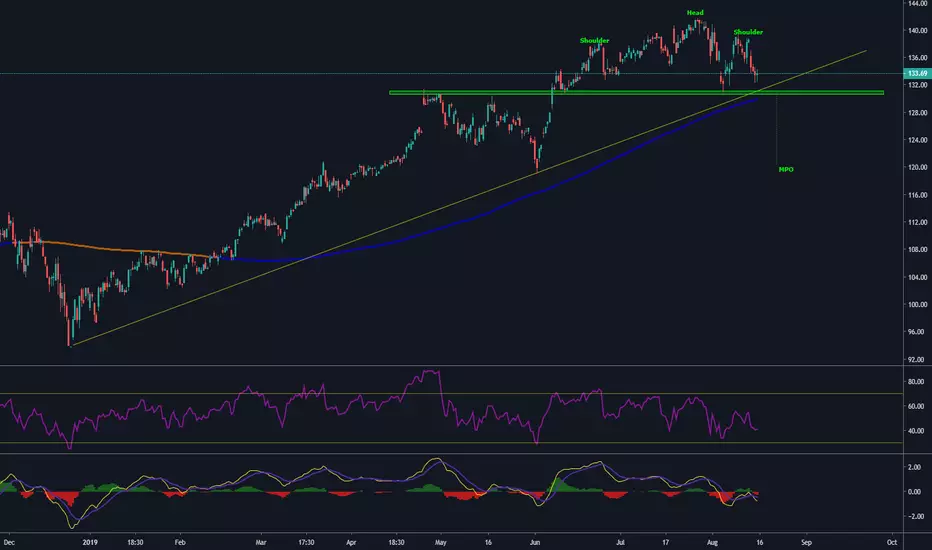
Chart analysis shows H&S pattern forming with divergence on both MACD and RSI. MPO target $120 support area and 200SMA on a daily chart (see in comments). First needs a good break through the trend line and 200SMA, quite strong support area around $130 level. If the market sell off continues next week, it could be the trigger for the pattern.
On the fundamental side major banks and investment funds see the stock as 'neutral-buy' and split price targets ranging from $115 to $160. Good Luck!
On the fundamental side major banks and investment funds see the stock as 'neutral-buy' and split price targets ranging from $115 to $160. Good Luck!
Ghi chú
Thông báo miễn trừ trách nhiệm
Thông tin và ấn phẩm không có nghĩa là và không cấu thành, tài chính, đầu tư, kinh doanh, hoặc các loại lời khuyên hoặc khuyến nghị khác được cung cấp hoặc xác nhận bởi TradingView. Đọc thêm trong Điều khoản sử dụng.
Thông báo miễn trừ trách nhiệm
Thông tin và ấn phẩm không có nghĩa là và không cấu thành, tài chính, đầu tư, kinh doanh, hoặc các loại lời khuyên hoặc khuyến nghị khác được cung cấp hoặc xác nhận bởi TradingView. Đọc thêm trong Điều khoản sử dụng.