Price Action View
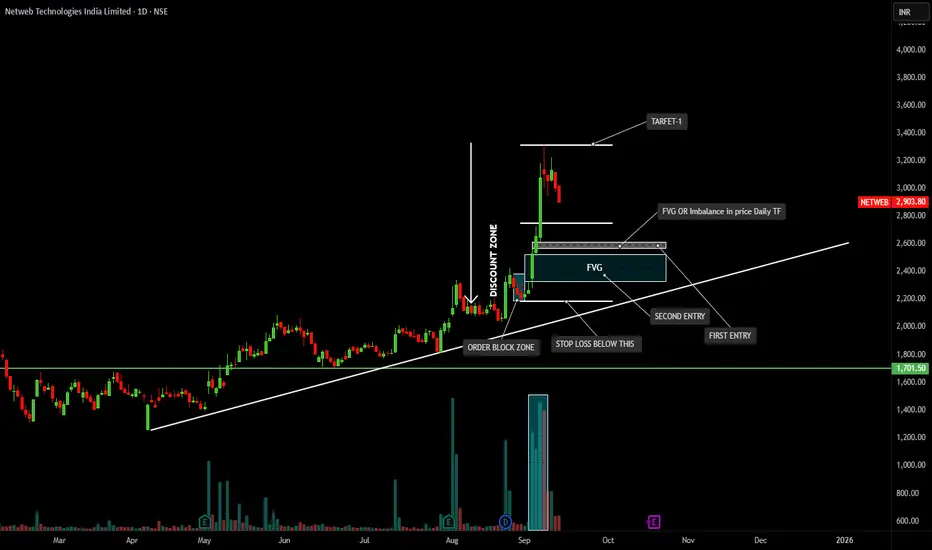
Stock had a strong breakout rally recently with heavy volume, creating an imbalance (FVG – Fair Value Gap) in the daily chart.
After the sharp move, price is now retracing downwards into the discount zone & order block area.
🟢 Bullish Points
Clear uptrend structure – higher highs and higher lows.
Strong volume spike confirms institutional interest.
Price is approaching the FVG zone (₹2,200–₹2,400) which can act as a demand zone for a bounce.
🔴 Risk / Bearish Signs
Current correction is sharp (–3.2% today) → showing sellers still active.
If price breaks below ₹2,000, structure weakens and downside towards ₹1,700 support is possible.
🎯 Trading Plan (As per Chart Markings)
First Entry: around ₹2,200–₹2,300 (inside FVG).
Second Entry: if deeper retracement near ₹2,000.
Stop Loss: below order block (~₹1,850–₹1,900).
Target 1: around ₹3,300 (previous high / resistance).
✅ Summary
Stock is in a strong uptrend but currently cooling off after a big rally. Best approach is to wait for retracement into the FVG/Order Block zone and then look for buying opportunities with a stop loss below ₹1,900. If the setup works, upside target remains ₹3,200–₹3,300
Thông báo miễn trừ trách nhiệm
Thông tin và các ấn phẩm này không nhằm mục đích, và không cấu thành, lời khuyên hoặc khuyến nghị về tài chính, đầu tư, giao dịch hay các loại khác do TradingView cung cấp hoặc xác nhận. Đọc thêm tại Điều khoản Sử dụng.
Thông báo miễn trừ trách nhiệm
Thông tin và các ấn phẩm này không nhằm mục đích, và không cấu thành, lời khuyên hoặc khuyến nghị về tài chính, đầu tư, giao dịch hay các loại khác do TradingView cung cấp hoặc xác nhận. Đọc thêm tại Điều khoản Sử dụng.