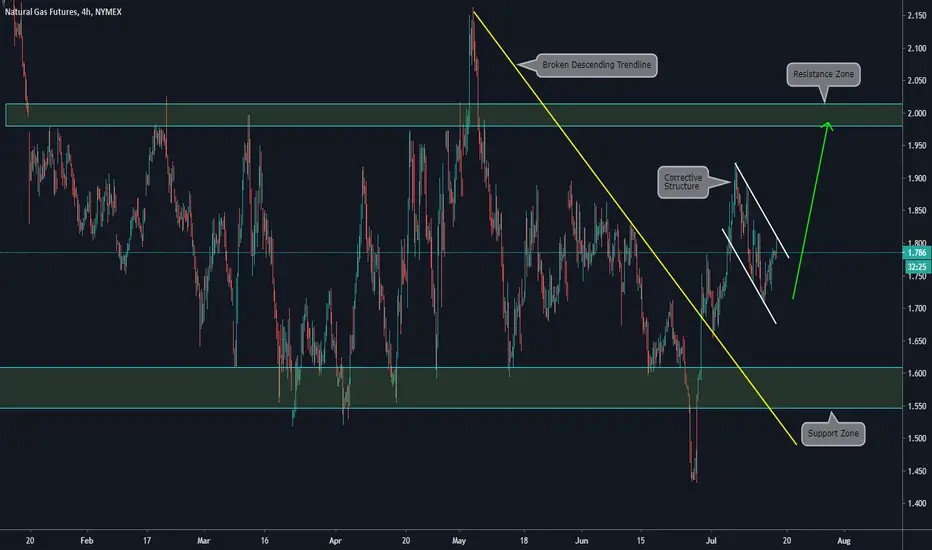
Main items we can see on the chart:
a) The price is inside a clear range, between a support and a resistance zone
b) Inside the range, we can see a broken descending trendline after the price bounced on the support zone
c) After the breakout, we can see a corrective Structure
d) If the Corrective Structure is broken we expect a continuation of the bullish movement, towards the next resistance zone
Thông báo miễn trừ trách nhiệm
Thông tin và các ấn phẩm này không nhằm mục đích, và không cấu thành, lời khuyên hoặc khuyến nghị về tài chính, đầu tư, giao dịch hay các loại khác do TradingView cung cấp hoặc xác nhận. Đọc thêm tại Điều khoản Sử dụng.
Thông báo miễn trừ trách nhiệm
Thông tin và các ấn phẩm này không nhằm mục đích, và không cấu thành, lời khuyên hoặc khuyến nghị về tài chính, đầu tư, giao dịch hay các loại khác do TradingView cung cấp hoặc xác nhận. Đọc thêm tại Điều khoản Sử dụng.