The head and shoulders pattern is a technical analysis chart pattern used in trading to predict potential reversals in price trends. It’s primarily a bearish reversal pattern that appears after an uptrend, signaling that the price may soon decline.
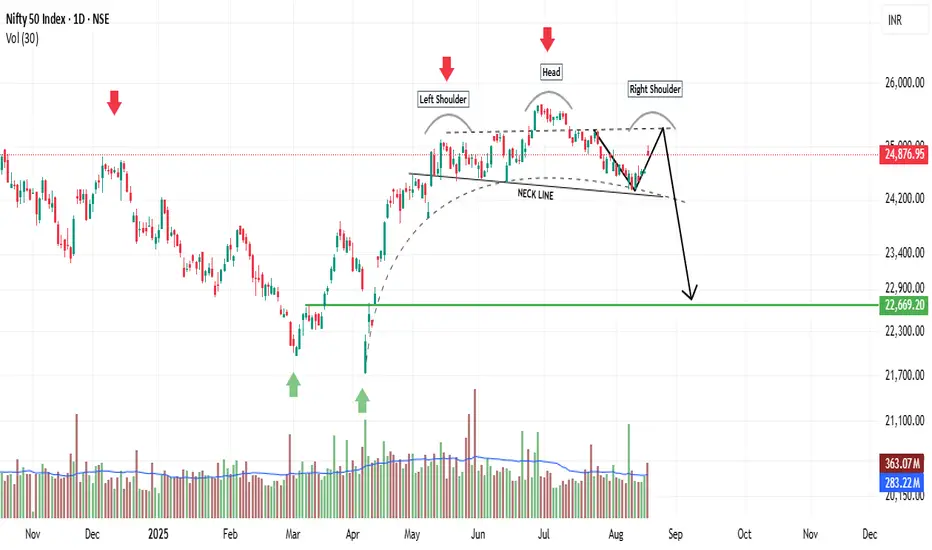
In the NIFTY
The pattern forms during an established uptrend, where prices are consistently making higher highs and higher lows from 07 April,2025
Left Shoulder: The price rises to a peak (a high) and then declines to a support level (a low), forming the first shoulder.( NEAR 25147-25253)
Head: The price rises again, surpassing the left shoulder’s high, reaching the highest point (the head), and then declines back to a similar support level as the left shoulder.(NEAR 25670)
Right Shoulder: The price rises once more but fails to reach the head’s high, forming a lower peak (the right shoulder), and then declines again. (NEAR 25100-25250)
Neckline: The line connecting the lows of the left shoulder, head, and right shoulder acts as a support level. It can be horizontal, sloped upward, or sloped downward, depending on the price action.( NEAR 24300)
Breakout Confirmation
The pattern is confirmed when the price breaks below the neckline after forming the right shoulder in a bearish head and shoulders pattern. This breakout signals that the uptrend is reversing into a downtrend.
So, I expect a good bearish move end of the week.
Thông báo miễn trừ trách nhiệm
Thông tin và các ấn phẩm này không nhằm mục đích, và không cấu thành, lời khuyên hoặc khuyến nghị về tài chính, đầu tư, giao dịch hay các loại khác do TradingView cung cấp hoặc xác nhận. Đọc thêm tại Điều khoản Sử dụng.
Thông báo miễn trừ trách nhiệm
Thông tin và các ấn phẩm này không nhằm mục đích, và không cấu thành, lời khuyên hoặc khuyến nghị về tài chính, đầu tư, giao dịch hay các loại khác do TradingView cung cấp hoặc xác nhận. Đọc thêm tại Điều khoản Sử dụng.