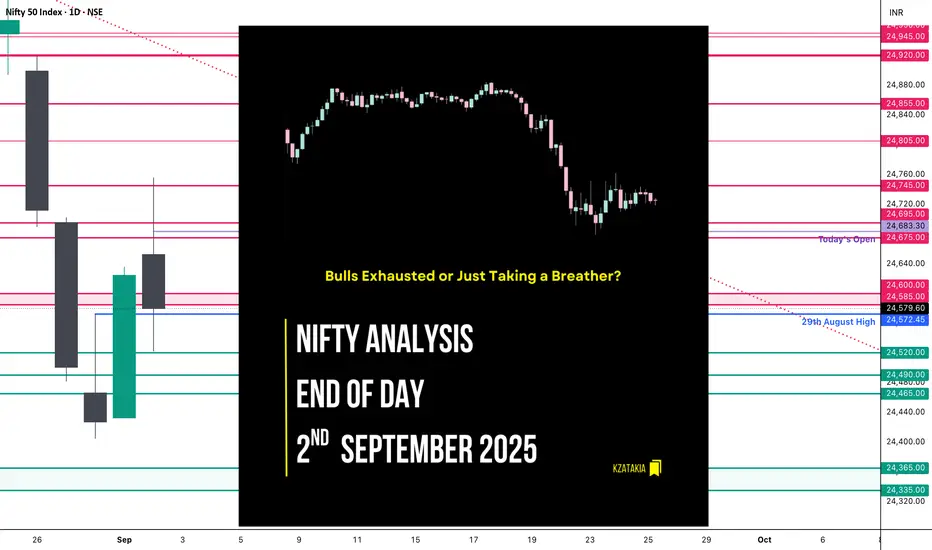
🟢 Nifty Analysis EOD – September 2, 2025 – Tuesday 🔴
Bulls Exhausted or Just Taking a Breather?
🗞 Nifty Summary
Nifty opened with a 62-point gap-up above the previous day’s high, but the excitement didn’t last long. The index quickly rushed to fill the gap, pulled back, and initially tried to extend the bullish sentiment from yesterday. However, the 24,750 hurdle proved too strong.
After multiple failed attempts to break above it, Nifty slipped below key supports — mean, CDL, PDH, PDC, and the 24,600–24,585 support zone — finally taking a pause around 24,520.
The big question: Was this just a weekly expiry adjustment or early signs of bullish momentum exhaustion?
For the upcoming sessions, the critical range is 24,750 ~ 24,500.
🛡 5 Min Intraday Chart with Levels

📉 Daily Time Frame Chart with Intraday Levels

🕯️ Daily Candle Breakdown
🏗️ Structure Breakdown
This created a long upper wick → intraday bullish attempt got rejected.
🕯Candle Type
Shooting Star–like red candle → reflects bullish exhaustion and supply pressure.
📚 Interpretation
📉 Short-Term View
👉 If bulls reclaim 24,750+, momentum revives.
👉 If 24,520 breaks, sellers may gain the upper hand.
In short: Market is in a tug-of-war zone between 24,750 and 24,520.
🛡 5 Min Intraday Chart

⚔️ Gladiator Strategy Update
📌 Support & Resistance Levels
Resistance Zones:
Support Zones:
💭 Final Thoughts
The index showed signs of exhaustion near 24,750. Whether this is just expiry-related or a genuine pause in momentum, tomorrow’s action will confirm.
"Markets don’t lie, they whisper. Today’s rejection was one such whisper — respect it."
✏️ Disclaimer
This is just my personal viewpoint. Always consult your financial advisor before taking any action.
Bulls Exhausted or Just Taking a Breather?
🗞 Nifty Summary
Nifty opened with a 62-point gap-up above the previous day’s high, but the excitement didn’t last long. The index quickly rushed to fill the gap, pulled back, and initially tried to extend the bullish sentiment from yesterday. However, the 24,750 hurdle proved too strong.
After multiple failed attempts to break above it, Nifty slipped below key supports — mean, CDL, PDH, PDC, and the 24,600–24,585 support zone — finally taking a pause around 24,520.
The big question: Was this just a weekly expiry adjustment or early signs of bullish momentum exhaustion?
For the upcoming sessions, the critical range is 24,750 ~ 24,500.
🛡 5 Min Intraday Chart with Levels
📉 Daily Time Frame Chart with Intraday Levels
🕯️ Daily Candle Breakdown
- Open: 24,653.00
- High: 24,756.10
- Low: 24,522.35
- Close: 24,579.60
- Change: −45.45 (−0.18%)
🏗️ Structure Breakdown
- Red candle (Close < Open).
- Body: 73.40 points → moderate.
- Upper wick: 103.10 points (strong rejection near high).
- Lower wick: 57.25 points (buyers attempted defense).
This created a long upper wick → intraday bullish attempt got rejected.
🕯Candle Type
Shooting Star–like red candle → reflects bullish exhaustion and supply pressure.
📚 Interpretation
- Gap-up open above previous close (24,625 → 24,653).
- Bulls attempted to break 24,750, but failed multiple times.
- Sellers dominated late, dragging the index red.
- Strong rejection shows supply pressure near 24,750.
📉 Short-Term View
- Resistance: 24,750 (rejection zone).
- Support: 24,520 (today’s low).
- Context: Yesterday’s bullish Marubozu was negated by today’s failure.
👉 If bulls reclaim 24,750+, momentum revives.
👉 If 24,520 breaks, sellers may gain the upper hand.
In short: Market is in a tug-of-war zone between 24,750 and 24,520.
🛡 5 Min Intraday Chart
⚔️ Gladiator Strategy Update
- ATR: 205.07
- IB Range: 98.85 → Medium
- Market Structure: Balanced
- Trade Highlight:
- 13:50 Short Trigger → Target Hit (R:R = 1:1.5)
📌 Support & Resistance Levels
Resistance Zones:
- 24,675 ~ 24,695
- 24,745
- 24,805
- 24,855
Support Zones:
- 24,575
- 24,520
- 24,490 ~ 24,465
💭 Final Thoughts
The index showed signs of exhaustion near 24,750. Whether this is just expiry-related or a genuine pause in momentum, tomorrow’s action will confirm.
"Markets don’t lie, they whisper. Today’s rejection was one such whisper — respect it."
✏️ Disclaimer
This is just my personal viewpoint. Always consult your financial advisor before taking any action.
Read my blogs here:
substack.com/@kzatakia
Follow me on Telegram:
t.me/swingtraderhub
Follow me on X:
x.com/kzatakia
substack.com/@kzatakia
Follow me on Telegram:
t.me/swingtraderhub
Follow me on X:
x.com/kzatakia
Bài đăng liên quan
Thông báo miễn trừ trách nhiệm
Thông tin và ấn phẩm không có nghĩa là và không cấu thành, tài chính, đầu tư, kinh doanh, hoặc các loại lời khuyên hoặc khuyến nghị khác được cung cấp hoặc xác nhận bởi TradingView. Đọc thêm trong Điều khoản sử dụng.