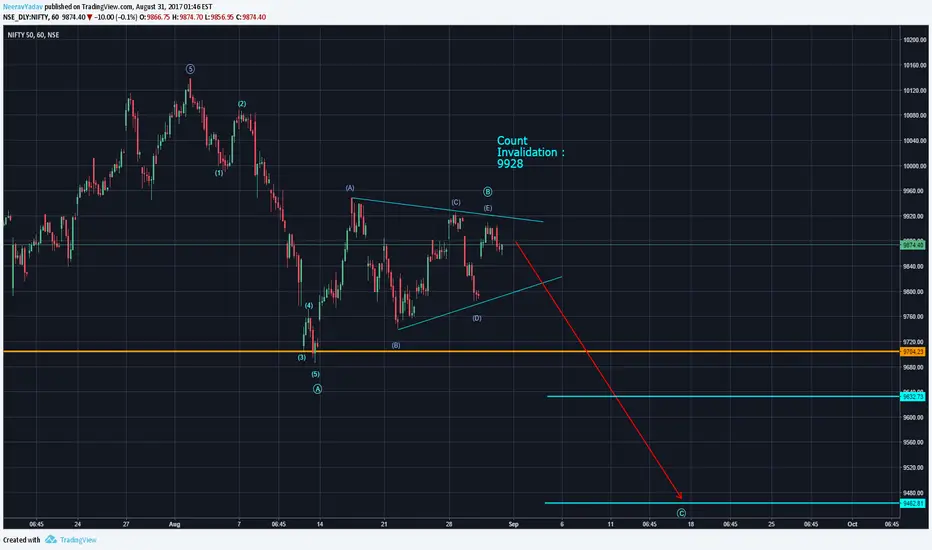
After the decline from 10000 + level it seems that we had a 5 legged down movement which seems to be followed by a Triangle, since triangles can not appear in Wave 2 positions hence the most likely possibility is that Nifty will see another leg down from here on as a Wave C down once the level of 9784 is broken which is also the low of Wave D in the Triangle Wave B (Circled).
If things proceed as expected then we can expect Wave C to reach targets :
T1 : 9632
T2 : 9460
In the upcoming sessions.
I would also like to point out here that triangles can become more complex then expected and hence it might be possible that this structure might still be progressing, hence strict Stop Losses must be used and a less aggressive trading approach would be more suitable in this situation.
I will update further as this market progresses
Ghi chú
Low Probability Alternate Bearish Count in Green : Ghi chú
*Bullish Count in Green.Ghi chú
Updated Count : Looks like a Flat correction may be going on, however if the level of 10090 is taken then the view turns bullish and I will have to take another look. Unmatched 80% plus forecast accuracy for 6 years : 50eyes.com/forecast-accuracy/
Video Course : 50eyes.com/elliott-wave-course
Author : Think with the Markets
Video Course : 50eyes.com/elliott-wave-course
Author : Think with the Markets
Bài đăng liên quan
Thông báo miễn trừ trách nhiệm
Thông tin và ấn phẩm không có nghĩa là và không cấu thành, tài chính, đầu tư, kinh doanh, hoặc các loại lời khuyên hoặc khuyến nghị khác được cung cấp hoặc xác nhận bởi TradingView. Đọc thêm trong Điều khoản sử dụng.
Unmatched 80% plus forecast accuracy for 6 years : 50eyes.com/forecast-accuracy/
Video Course : 50eyes.com/elliott-wave-course
Author : Think with the Markets
Video Course : 50eyes.com/elliott-wave-course
Author : Think with the Markets
Bài đăng liên quan
Thông báo miễn trừ trách nhiệm
Thông tin và ấn phẩm không có nghĩa là và không cấu thành, tài chính, đầu tư, kinh doanh, hoặc các loại lời khuyên hoặc khuyến nghị khác được cung cấp hoặc xác nhận bởi TradingView. Đọc thêm trong Điều khoản sử dụng.