4-Hour Chart (Macro Trend)
Structure: The Nifty is in an Aggressive Bullish Momentum phase, but the recent 4H candle shows a deep correction that broke below the lower trendline of the steep ascending channel. This signals a Market Structure Shift (MSS) on the aggressive short-term momentum. The correction closed right on the FVG (Fair Value Gap), suggesting this zone will be critical.
Key Levels:
Major Supply (Resistance): 25,950 - 26,100. This area (the high from Oct 23) is the immediate overhead hurdle. A break above 26,100 would target the ATH.
Major Demand (Support): 25,400 - 25,550. This area, which includes the largest FVG and a strong accumulation zone, is the must-hold level for the overall weekly bullish bias.
Outlook: The bias is Corrective within an Uptrend. We expect consolidation or a retest of the lower support levels before the bulls can attempt a fresh ATH breakout.
1-Hour Chart (Intermediate View)
Structure: The 1H chart shows a clear descending channel formed during Friday's trading, confirming the short-term correction. The index has lost momentum and closed near the day's low.
Key Levels:
Immediate Resistance: 25,900 (Previous swing low/upper channel boundary).
Immediate Support: 25,600 (Lower channel boundary/FVG zone).
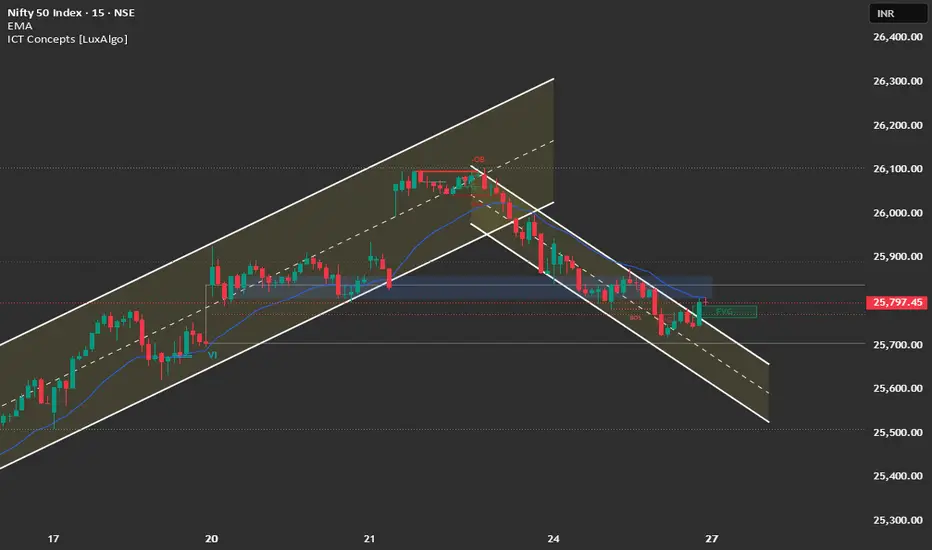
15-Minute Chart (Intraday View)
Structure: The 15M chart confirms the steep descending channel. The price is currently testing the lower end of the channel, having already broken the immediate short-term support and leaving an FVG overhead (around 25,900).
Key Levels:
Intraday Supply: 25,900.
Intraday Demand: 25,600.
Outlook: Bearish for the session open. A "Sell on Rise" strategy near the channel resistance is favorable.
📈 Trade Plan (Monday, 27th October)
Market Outlook: Nifty is undergoing a sharp correction, fueled by a renewed focus on global risks. The key lies in defending the 25,600 - 25,700 support zone.
Bearish Scenario (Primary Plan: Correction Continuation/Sell on Rise)
Justification: The breakdown of the steep channel and the formation of a descending channel favor continuation toward the 25,500 support.
Entry: Short entry on a retest and rejection of the 25,900 - 25,950 level (upper channel/FVG) OR Short a decisive break and 15-minute candle close below 25,750.
Stop Loss (SL): Place a stop loss above 26,000 (above the last swing high).
Targets:
T1: 25,600 (Lower channel support/Major FVG).
T2: 25,500 (Major weekly support).
Bullish Scenario (Counter-Trend/Bounce)
Justification: The macro trend remains bullish. A strong bounce from support is possible.
Trigger: A sustained move and close above 26,000.
Entry: Long entry on a confirmed 15-minute close above 26,000.
Stop Loss (SL): Below 25,850.
Targets:
T1: 26,100 (Retest of previous high).
T2: 26,277 (All-Time High).
Key Levels for Observation:
Immediate Decision Point: 25,750 - 25,900 zone.
Bearish Confirmation: Sustained trade below 25,750.
Bullish Warning: A move back above 26,000.
Line in the Sand: 25,500. Below this level, the risk of a deep correction increases significantly.
Structure: The Nifty is in an Aggressive Bullish Momentum phase, but the recent 4H candle shows a deep correction that broke below the lower trendline of the steep ascending channel. This signals a Market Structure Shift (MSS) on the aggressive short-term momentum. The correction closed right on the FVG (Fair Value Gap), suggesting this zone will be critical.
Key Levels:
Major Supply (Resistance): 25,950 - 26,100. This area (the high from Oct 23) is the immediate overhead hurdle. A break above 26,100 would target the ATH.
Major Demand (Support): 25,400 - 25,550. This area, which includes the largest FVG and a strong accumulation zone, is the must-hold level for the overall weekly bullish bias.
Outlook: The bias is Corrective within an Uptrend. We expect consolidation or a retest of the lower support levels before the bulls can attempt a fresh ATH breakout.
1-Hour Chart (Intermediate View)
Structure: The 1H chart shows a clear descending channel formed during Friday's trading, confirming the short-term correction. The index has lost momentum and closed near the day's low.
Key Levels:
Immediate Resistance: 25,900 (Previous swing low/upper channel boundary).
Immediate Support: 25,600 (Lower channel boundary/FVG zone).
15-Minute Chart (Intraday View)
Structure: The 15M chart confirms the steep descending channel. The price is currently testing the lower end of the channel, having already broken the immediate short-term support and leaving an FVG overhead (around 25,900).
Key Levels:
Intraday Supply: 25,900.
Intraday Demand: 25,600.
Outlook: Bearish for the session open. A "Sell on Rise" strategy near the channel resistance is favorable.
📈 Trade Plan (Monday, 27th October)
Market Outlook: Nifty is undergoing a sharp correction, fueled by a renewed focus on global risks. The key lies in defending the 25,600 - 25,700 support zone.
Bearish Scenario (Primary Plan: Correction Continuation/Sell on Rise)
Justification: The breakdown of the steep channel and the formation of a descending channel favor continuation toward the 25,500 support.
Entry: Short entry on a retest and rejection of the 25,900 - 25,950 level (upper channel/FVG) OR Short a decisive break and 15-minute candle close below 25,750.
Stop Loss (SL): Place a stop loss above 26,000 (above the last swing high).
Targets:
T1: 25,600 (Lower channel support/Major FVG).
T2: 25,500 (Major weekly support).
Bullish Scenario (Counter-Trend/Bounce)
Justification: The macro trend remains bullish. A strong bounce from support is possible.
Trigger: A sustained move and close above 26,000.
Entry: Long entry on a confirmed 15-minute close above 26,000.
Stop Loss (SL): Below 25,850.
Targets:
T1: 26,100 (Retest of previous high).
T2: 26,277 (All-Time High).
Key Levels for Observation:
Immediate Decision Point: 25,750 - 25,900 zone.
Bearish Confirmation: Sustained trade below 25,750.
Bullish Warning: A move back above 26,000.
Line in the Sand: 25,500. Below this level, the risk of a deep correction increases significantly.
Thông báo miễn trừ trách nhiệm
Thông tin và các ấn phẩm này không nhằm mục đích, và không cấu thành, lời khuyên hoặc khuyến nghị về tài chính, đầu tư, giao dịch hay các loại khác do TradingView cung cấp hoặc xác nhận. Đọc thêm tại Điều khoản Sử dụng.
Thông báo miễn trừ trách nhiệm
Thông tin và các ấn phẩm này không nhằm mục đích, và không cấu thành, lời khuyên hoặc khuyến nghị về tài chính, đầu tư, giao dịch hay các loại khác do TradingView cung cấp hoặc xác nhận. Đọc thêm tại Điều khoản Sử dụng.