📊 Market Structure Analysis
4H Timeframe
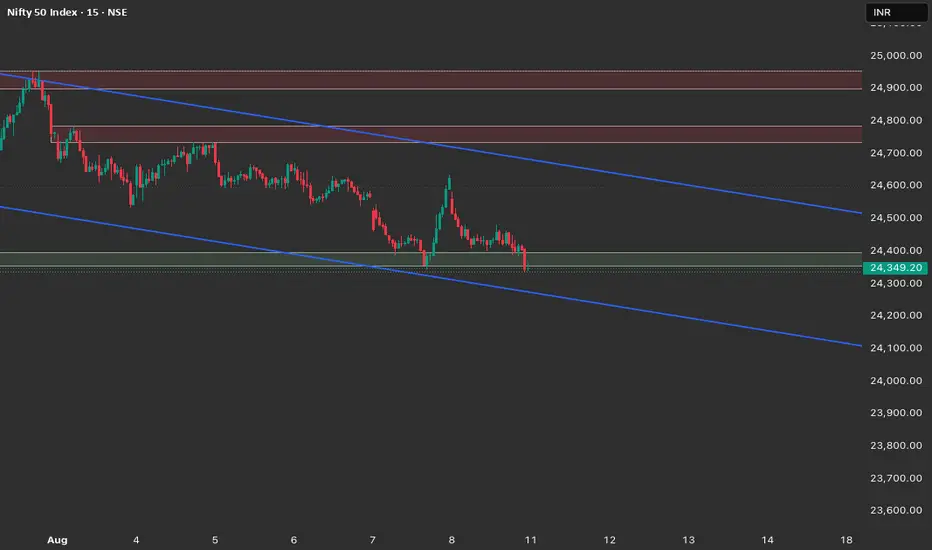
Price remains in a clear downtrend with consistent lower highs and lower lows.
The recent candle is testing the lower boundary of the immediate demand zone near 24,340–24,320.
A clean break and close below this level can extend the bearish leg toward 24,200.
1H Timeframe
Price action shows a grind down with no strong bullish attempts.
Supply zones remain intact at 24,460–24,500 and 24,600–24,640.
Weak bounce attempts are getting absorbed quickly, signalling strong selling pressure.
15M Timeframe
Intraday structure is also bearish.
Minor liquidity grab attempts near 24,360 have failed to sustain.
No significant bullish market structure shift yet.
📌 Trade Plan for 11th August (Nifty 50)
🎯 Bias: Bearish unless a strong bullish reversal candle forms above 24,500.
🔻 Short Setup
Entry Zone: 24,440–24,480 (retest of intraday supply).
Stop Loss: Above 24,500.
Targets:
T1: 24,350
T2: 24,200 (extended target if breakdown holds).
🔼 Long Setup (Counter-Trend, Risky)
Only if price retests 24,300–24,320 and prints a strong bullish engulfing/reversal candle on 15M.
Entry: Near 24,320 demand zone.
Stop Loss: Below 24,280.
Targets:
T1: 24,460
🚫 No-Trade Zone
24,320 – 24,440
This range is a congestion area where:
Multiple wicks and failed breakouts have occurred in the past sessions.
Both buyers and sellers have been active, leading to whipsaws.
Low risk-reward for both breakout and reversal plays unless price closes decisively outside.
4H Timeframe
Price remains in a clear downtrend with consistent lower highs and lower lows.
The recent candle is testing the lower boundary of the immediate demand zone near 24,340–24,320.
A clean break and close below this level can extend the bearish leg toward 24,200.
1H Timeframe
Price action shows a grind down with no strong bullish attempts.
Supply zones remain intact at 24,460–24,500 and 24,600–24,640.
Weak bounce attempts are getting absorbed quickly, signalling strong selling pressure.
15M Timeframe
Intraday structure is also bearish.
Minor liquidity grab attempts near 24,360 have failed to sustain.
No significant bullish market structure shift yet.
📌 Trade Plan for 11th August (Nifty 50)
🎯 Bias: Bearish unless a strong bullish reversal candle forms above 24,500.
🔻 Short Setup
Entry Zone: 24,440–24,480 (retest of intraday supply).
Stop Loss: Above 24,500.
Targets:
T1: 24,350
T2: 24,200 (extended target if breakdown holds).
🔼 Long Setup (Counter-Trend, Risky)
Only if price retests 24,300–24,320 and prints a strong bullish engulfing/reversal candle on 15M.
Entry: Near 24,320 demand zone.
Stop Loss: Below 24,280.
Targets:
T1: 24,460
🚫 No-Trade Zone
24,320 – 24,440
This range is a congestion area where:
Multiple wicks and failed breakouts have occurred in the past sessions.
Both buyers and sellers have been active, leading to whipsaws.
Low risk-reward for both breakout and reversal plays unless price closes decisively outside.
Thông báo miễn trừ trách nhiệm
Thông tin và ấn phẩm không có nghĩa là và không cấu thành, tài chính, đầu tư, kinh doanh, hoặc các loại lời khuyên hoặc khuyến nghị khác được cung cấp hoặc xác nhận bởi TradingView. Đọc thêm trong Điều khoản sử dụng.
Thông báo miễn trừ trách nhiệm
Thông tin và ấn phẩm không có nghĩa là và không cấu thành, tài chính, đầu tư, kinh doanh, hoặc các loại lời khuyên hoặc khuyến nghị khác được cung cấp hoặc xác nhận bởi TradingView. Đọc thêm trong Điều khoản sử dụng.