4-Hour Chart (Swing Context)
Trend: The market is currently in an ascending channel formation after a prior downtrend.
Key Zone: The price is approaching the 25,200-25,300 supply zone, which is a significant resistance area.
Previous Break: The price has broken above the 25,100 level, which is now acting as a potential demand zone.
Bias: The overall momentum is bullish, but the price is currently within a major resistance zone.
1-Hour Chart (Intraday Context)
Structure: The price action is forming a clear pattern of higher highs and higher lows, indicating a bullish structure.
Support: The 25,100 level, which was previously resistance, is now acting as a support zone and showing strong bounces.
Current Action: The price is currently consolidating below the 25,200-25,300 supply zone.
BOS: The buying order flow is still dominant, but the upside liquidity appears to be thinning.
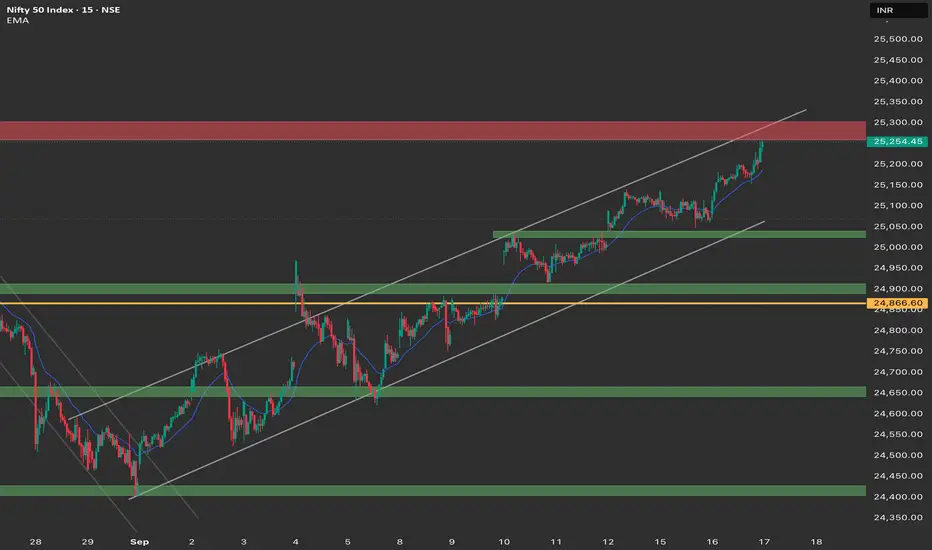
15-Minute Chart (Execution View)
Action: The price is in a sideways consolidation pattern below the 25,250 level.
OB: The order block around 25,050-25,100 is acting as a support buffer.
FVG: Minor FVGs in the 25,150-25,180 zone may offer intraday support.
Channel: The price is respecting the ascending channel boundaries.
Trade Plan (17th September)
Bullish Scenario
Entry: Buy on a retracement towards the 25,050-25,100 demand zone (OB + structure support).
Targets:
TP1: 25,200 (intraday liquidity)
TP2: 25,300 (supply zone top & channel resistance)
Stop Loss: Below 24,950 (channel bottom & invalidation).
Bearish Scenario
Entry: Short on a rejection of the 25,200-25,300 supply zone with a strong bearish signal (e.g., engulfing candle).
Targets:
TP1: 25,150 (potential FVG fill)
TP2: 25,050-25,100 (major demand zone/OB)
Stop Loss: Above 25,300.
Bias: Neutral-to-Bullish. Expecting a potential pullback to 25,050-25,100 before a move towards the 25,200-25,300 resistance zone.
Caution: If the 25,050-25,100 demand zone fails to hold, expect a further downside acceleration towards 24,800-24,600.
Thông báo miễn trừ trách nhiệm
Thông tin và ấn phẩm không có nghĩa là và không cấu thành, tài chính, đầu tư, kinh doanh, hoặc các loại lời khuyên hoặc khuyến nghị khác được cung cấp hoặc xác nhận bởi TradingView. Đọc thêm trong Điều khoản sử dụng.
Thông báo miễn trừ trách nhiệm
Thông tin và ấn phẩm không có nghĩa là và không cấu thành, tài chính, đầu tư, kinh doanh, hoặc các loại lời khuyên hoặc khuyến nghị khác được cung cấp hoặc xác nhận bởi TradingView. Đọc thêm trong Điều khoản sử dụng.