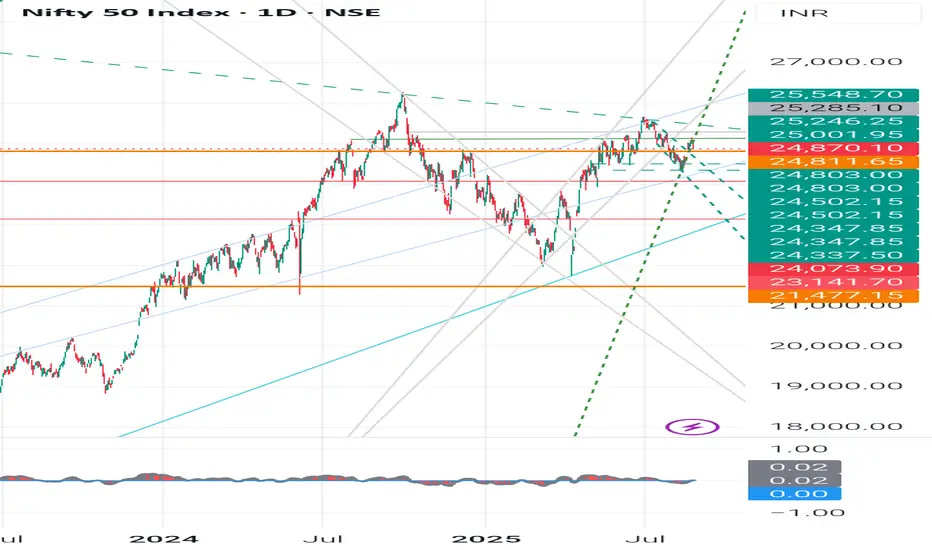
Nifty 50 - Technical Chart Analysis (as per Daily chart)
Current Price (CMP): 25,070
Trend: Sideways consolidation between 24,500 - 25,500 levels.
Chart Pattern:
Multiple tests of 25,500 - strong resistance.
Multiple supports around 24,500 - 24,800 - strong demand zone.
The broad pattern looks like a Rectangle / Range-bound movement.
Swing Analysis:
Higher swing lows visible after 24,000 - bullish undertone.
Lower swing highs at 25,500 - supply pressure.
Key Levels
- Immediate Resistance: 25,250 - 25,550 - 26,000
- Immediate Support: 24,800 - 24,500 - 24,073
Major Support: 23,141 - 21,477 (long-term trend support)
👉Candlestick Learnings (Recent Pattern)
Recent candles show long wicks both sides - market indecision (buyers & sellers fighting).
A strong green bullish engulfing candle near 24,500 support - sign of buyers stepping in.
Current candles forming inside bars - breakout move expected soon (either above 25,500 or below 24,500).
✍️Student Learning Point:
When candles show long wicks near support - it signals accumulation.
When candles cluster near resistance - expect breakout/reversal.
Always confirm with volume before taking position.
Fundamental Comparison - Nifty Competitors (Index Peers)
Since Nifty 50 is an index, let’s compare with other global indices (macro investing perspective):
Index P/E Ratio Dividend Yield 5Y CAGR Returns Volatility
Nifty 50 -22-23 -1.2% -13% Moderate
Sensex -24 -1.1% -12% Moderate
Dow Jones -21 -1.7% -9% Lower
Nasdaq 100 -28 -0.9% -15% High
Shanghai Comp -17 -2.0% -5% Moderate
Learnings:
Nifty has a healthy P/E (not cheap, not too expensive).
Growth rate is higher than global averages - India is attractive long-term.
Volatility is moderate, making Nifty good for SIP investors & long-term compounding.
Investment Learnings for Students
1. Candlestick Patterns: Learn basics like Doji, Engulfing, Hammer, Shooting Star - they often show reversal/continuation.
2. Swing Analysis: Markets move in swings (higher highs/lows in uptrend, lower highs/lows in downtrend). Recognizing them helps in entry/exit.
3. Support & Resistance: Always mark key levels before trading/investing.
4. Fundamentals: Don’t just look at charts - check P/E, dividend yield, EPS growth, sector weightage.
5. Risk Management: Use stop-loss in trading. For investing, use SIP & diversify.
⚠️ Disclaimer
This analysis is for educational purposes only. Not a SEBI-registered advisory. Students & investors should do their own research or consult a financial advisor before making decisions.
#Nifty50 #StockMarketIndia #TechnicalAnalysis #InvestingForBeginners #CandlestickPatterns #SwingTrading #SupportAndResistance #StockMarketEducation #MarketLearning
Bài đăng liên quan
Thông báo miễn trừ trách nhiệm
Thông tin và các ấn phẩm này không nhằm mục đích, và không cấu thành, lời khuyên hoặc khuyến nghị về tài chính, đầu tư, giao dịch hay các loại khác do TradingView cung cấp hoặc xác nhận. Đọc thêm tại Điều khoản Sử dụng.
Bài đăng liên quan
Thông báo miễn trừ trách nhiệm
Thông tin và các ấn phẩm này không nhằm mục đích, và không cấu thành, lời khuyên hoặc khuyến nghị về tài chính, đầu tư, giao dịch hay các loại khác do TradingView cung cấp hoặc xác nhận. Đọc thêm tại Điều khoản Sử dụng.