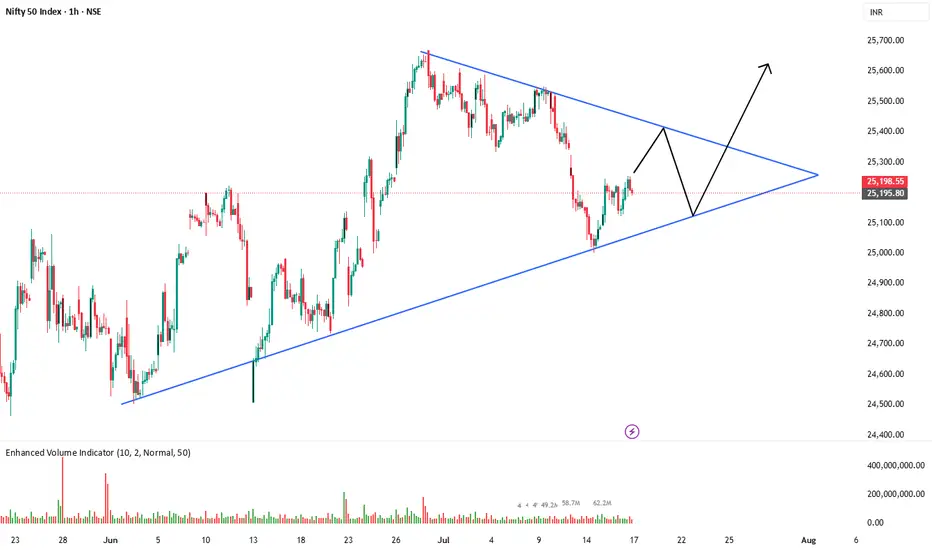
Nifty is currently consolidating within a symmetrical triangle pattern on the 1-hour chart. Price is respecting both the rising support and descending resistance trendlines.
Key observations:
Clear higher lows indicate underlying bullish pressure.
Lower highs show selling pressure near resistance.
Expecting a possible pullback toward the lower trendline before a potential breakout to the upside.
Trade Plan (if breakout occurs):
📈 Bullish breakout above the upper trendline could lead to a sharp rally.
✅ Confirmation needed with strong volume and candle close above resistance.
Invalid if price breaks below the support trendline.
Stay alert for a breakout or breakdown — both scenarios possible, but current structure slightly favors bulls.
Thông báo miễn trừ trách nhiệm
Thông tin và ấn phẩm không có nghĩa là và không cấu thành, tài chính, đầu tư, kinh doanh, hoặc các loại lời khuyên hoặc khuyến nghị khác được cung cấp hoặc xác nhận bởi TradingView. Đọc thêm trong Điều khoản sử dụng.
Thông báo miễn trừ trách nhiệm
Thông tin và ấn phẩm không có nghĩa là và không cấu thành, tài chính, đầu tư, kinh doanh, hoặc các loại lời khuyên hoặc khuyến nghị khác được cung cấp hoặc xác nhận bởi TradingView. Đọc thêm trong Điều khoản sử dụng.