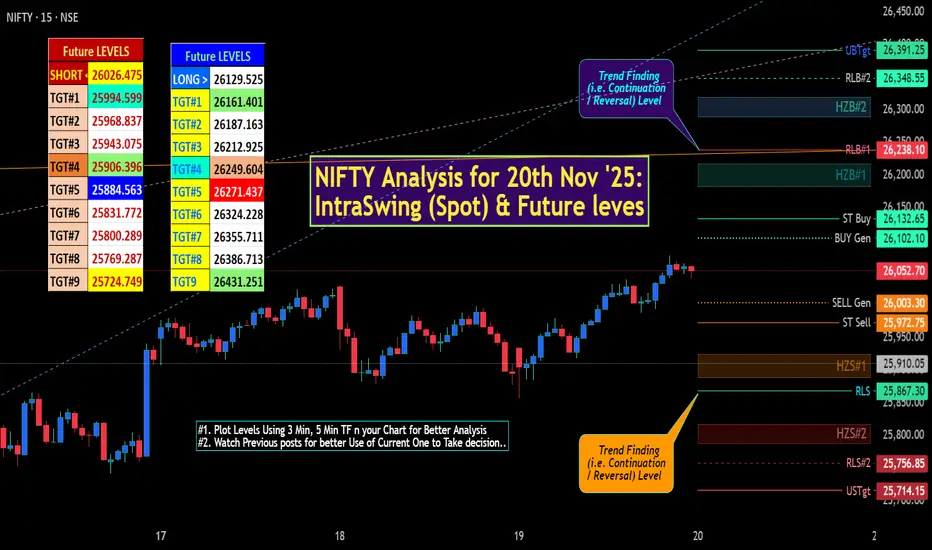
✍🏼️ "Future IntraSwing Levels" mentioned in BOX format.
✍🏼️ "WEEKLY Levels" follow Sunday / Saturday's Post.
Useful to Tally / Recognize for Next day Trade Plan.
Useful to Tally / Recognize or sometime DETECT abnormal Movement of NIFTY for Next day Trade Plan.
[Level Interpretation / description:
L#1: If the candle crossed & stays above the “Buy Gen”, it is treated / considered as Bullish bias.
L#2: Possibility / Probability of REVERSAL near RLB#1 & UBTgt
L#3: If the candle stays above “Sell Gen” but below “Buy Gen”, it is treated / considered as Sidewise. Aggressive Traders can take Long position near “Sell Gen” either retesting or crossed from Below & vice-versa i.e. can take Short position near “Buy Gen” either retesting or crossed downward from Above.
L#4: If the candle crossed & stays below the “Sell Gen”, it is treated / considered a Bearish bias.
L#5: Possibility / Probability of REVERSAL near RLS#1 & USTgt
HZB (Buy side) & HZS (Sell side) => Hurdle Zone,
*** Specialty of “HZB#1, HZB#2 HZS#1 & HZS#2” is Sidewise (behaviour in Nature)
Rest Plotted and Mentioned on Chart
Color code Used:
Green =. Positive bias.
Red =. Negative bias.
RED in Between Green means Trend Finder / Momentum Change
/ CYCLE Change and Vice Versa.
Notice One thing: HOW LEVELS are Working.
Use any Momentum Indicator / Oscillatoror as you "USED to" to Take entry.
⚠️ DISCLAIMER:
The information, views, and ideas shared here are purely for educational and informational purposes only. They are not intended as investment advice or a recommendation to buy, sell, or hold any financial instruments. I am not a SEBI-registered financial adviser.
Trading and investing in the stock market involves risk, and you should do your own research and analysis. You are solely responsible for any decisions made based on this research.
"As HARD EARNED MONEY IS YOUR's, So DECISION SHOULD HAVE TO BE YOUR's".
Do comment if Helpful.
In depth Analysis will be added later (If time Permits)
Ghi chú
Market OverviewSpot Level: NIFTY 50 opened positively at ~26,132 (+80 pts, +0.31% from previous close of 26,052), fueled by Nvidia-led global tech rally and strong Asian handoff. Current level: 26,103 (mid-morning consolidation after initial surge). GIFT Nifty traded at 26,116 (+0.23%), signaling sustained optimism.
Technical Analysis: Bullish hammer on hourly chart, reclaiming 21-EMA (26,000) with strong volume; RSI(14) at 64 (bullish territory), MACD bullish crossover intact, STOCH at 80 (nearing overbought). Key Resistance / Support: FOLLOW CHART LEVEL. Implied Volatility ~28% (down from 32%, post-rally calm favors call buyers). Greeks: Delta ~0.52 for ATM CE, theta ~₹11/day.
Fundamental Cues: DIIs net buyers (+₹1,360 Cr on Nov 19, countering FII net selling of -₹729 Cr); sectoral boosts in IT (+1.2%, Infosys +2% on Q2 beats) and Metals (+0.8%). Macro: RBI eyes additional 50 bps cuts over 12 months amid low inflation; rupee at 83.48. Global: Nvidia surge adds $250 Bn market cap, Nikkei +3.06%, Dow futures +0.71%.
News Sentiment: Positive (X posts highlight "Nvidia magic" spillover and GIFT positivity; headlines on flattish-to-up open, RBI dovishness). Geopolitical: Neutral, focus on US Fed/PMI cues.
Bài đăng liên quan
Thông báo miễn trừ trách nhiệm
Thông tin và các ấn phẩm này không nhằm mục đích, và không cấu thành, lời khuyên hoặc khuyến nghị về tài chính, đầu tư, giao dịch hay các loại khác do TradingView cung cấp hoặc xác nhận. Đọc thêm tại Điều khoản Sử dụng.
Bài đăng liên quan
Thông báo miễn trừ trách nhiệm
Thông tin và các ấn phẩm này không nhằm mục đích, và không cấu thành, lời khuyên hoặc khuyến nghị về tài chính, đầu tư, giao dịch hay các loại khác do TradingView cung cấp hoặc xác nhận. Đọc thêm tại Điều khoản Sử dụng.