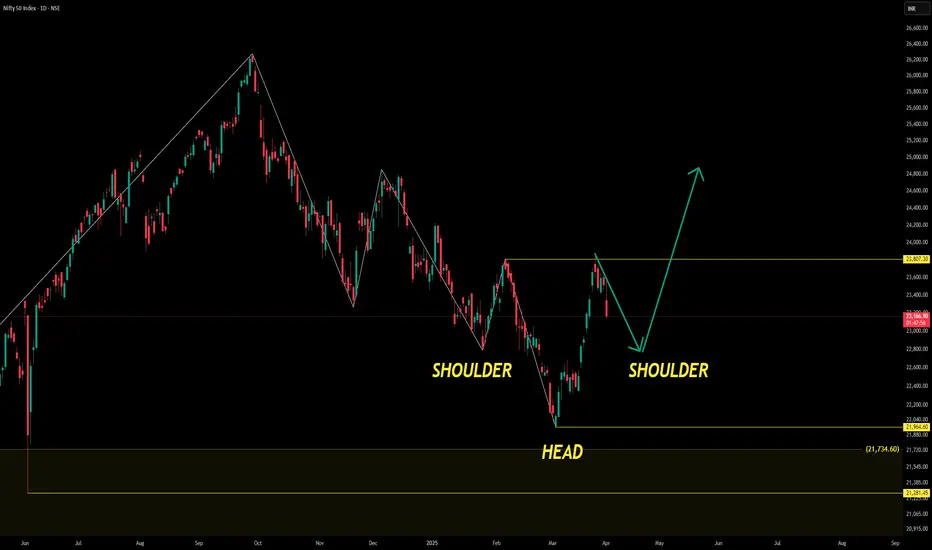
The Head and Shoulders consists of three distinct peaks:
Left Shoulder: A peak observed towards the end of November, followed by a downward movement.
Head: The highest peak formed around early January, indicating a strong upward movement before declining.
Right Shoulder: A smaller peak formed in late March, followed by another decline.
The neckline, which is a horizontal line connecting the troughs between the shoulders and the head, is positioned near 21,734.60 INR. This neckline is a critical support level that traders closely monitor.
Potential Scenarios
Bearish Reversal: If the price breaks below the neckline, it could signal a bearish trend, potentially leading to further price declines. This aligns with classic Head and Shoulders behavior.
Bullish Breakout: There’s also an upward arrow on the chart suggesting a potential bullish breakout above the right shoulder, targeting a level of 23,807.30 INR. This would indicate a rejection of the bearish setup, leading to a trend reversal to the upside.
Additional Observations
The current price is 23,162.10 INR, down by 357.25 points (-1.52%), with a trading volume of 255.38M. This recent decline might indicate pressure near the neckline level, reinforcing its importance in upcoming sessions.
From this analysis, traders might:
Keep an eye on the neckline for signs of a breakdown or reversal.
Watch for volume spikes during any breakout or breakdown, as these could confirm the validity of the movement.
Thông báo miễn trừ trách nhiệm
Thông tin và ấn phẩm không có nghĩa là và không cấu thành, tài chính, đầu tư, kinh doanh, hoặc các loại lời khuyên hoặc khuyến nghị khác được cung cấp hoặc xác nhận bởi TradingView. Đọc thêm trong Điều khoản sử dụng.
Thông báo miễn trừ trách nhiệm
Thông tin và ấn phẩm không có nghĩa là và không cấu thành, tài chính, đầu tư, kinh doanh, hoặc các loại lời khuyên hoặc khuyến nghị khác được cung cấp hoặc xác nhận bởi TradingView. Đọc thêm trong Điều khoản sử dụng.