🔺 Pattern:
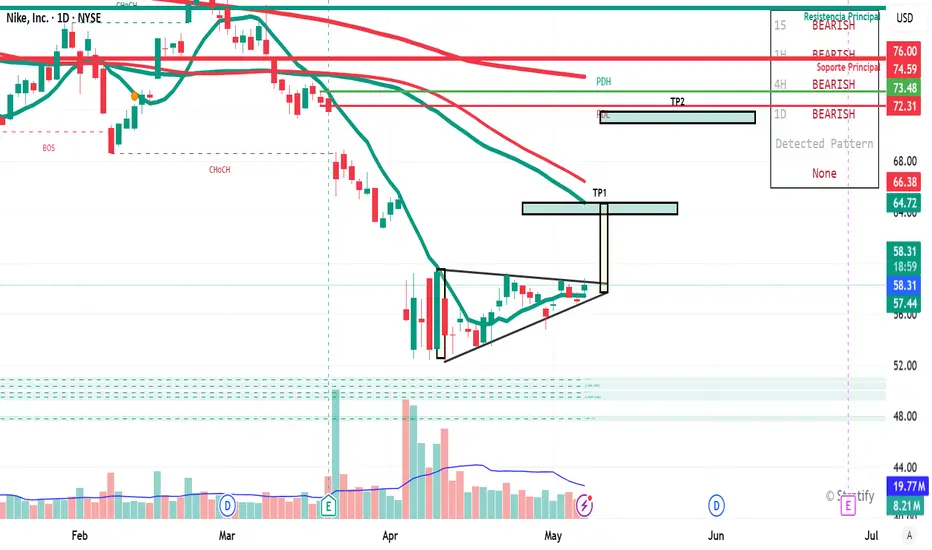
An ascending triangle is forming, which is a bullish technical pattern if it breaks out with volume above the resistance level.
The TP1 (Take Profit 1) marked in the $64.72–$66.38 USD zone is logical and aligns with previous resistance levels.
🟢 Bullish Signals:
Imminent triangle breakout: if the price strongly surpasses the $59–$60 USD range, it confirms the pattern.
Increasing volume on previous green candles: a good sign of accumulation.
Slightly expanding Bollinger Band: may indicate the beginning of a stronger move.
EMAs are flattening, with a possible future crossover if a rally confirms.
🔴 Risks and Key Levels to Watch:
The macro trend remains bearish: several timeframes (15m, 1H, 4H, 1D) show "BEARISH" zones.
Strong resistances: around $64.72, and especially between $72.31 and $76.00 USD.
If the breakout fails and price drops below $57.43, the pattern is invalidated and price may seek support at lower levels ($52–$50).
Giao dịch đang hoạt động
TP1 and TP2 reached!Đóng lệnh: đạt mục tiêu
Target reached!Thông báo miễn trừ trách nhiệm
Thông tin và ấn phẩm không có nghĩa là và không cấu thành, tài chính, đầu tư, kinh doanh, hoặc các loại lời khuyên hoặc khuyến nghị khác được cung cấp hoặc xác nhận bởi TradingView. Đọc thêm trong Điều khoản sử dụng.
Thông báo miễn trừ trách nhiệm
Thông tin và ấn phẩm không có nghĩa là và không cấu thành, tài chính, đầu tư, kinh doanh, hoặc các loại lời khuyên hoặc khuyến nghị khác được cung cấp hoặc xác nhận bởi TradingView. Đọc thêm trong Điều khoản sử dụng.