📉 NVIDIA Daily Chart Correction – Elliott Wave Insight
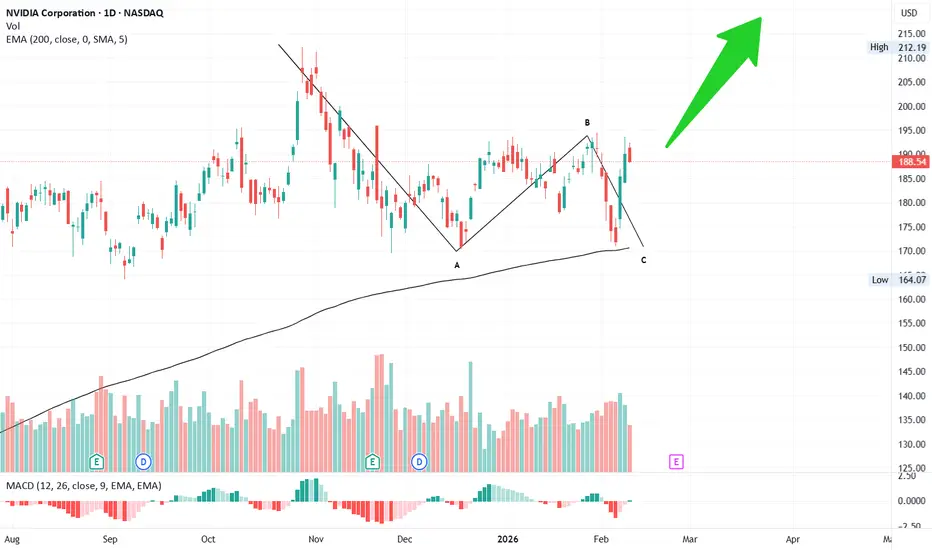
NVIDIA began its correction on 29 Oct ’25, topping at 212. From there, it declined sharply to 170 by 17 Dec ’25, completing the A wave.
📊 The A wave unfolded in 5 sub-waves, signaling a zig-zag correction pattern.
📈 As expected, the B wave retraced less than the 61.8% Fibonacci level, peaking at 197 on 29 Jan ’26.
💥 The C wave followed with a sharp downfall, finally completing on 5 Feb ’26 right at the 200 EMA on the daily chart.
🎯 Looking ahead, the next target sits at 220, aligning with the broader corrective structure and Fibonacci projections.
⚡ This sequence highlights the precision of Elliott Wave theory in capturing market psychology and corrective structures.
#Trading 📉 #ElliottWave 📊 #NVIDIA 💹 #TechnicalAnalysis 📈 #StockMarketInsights 💵 #Target 🎯 #Stocks 📊 #Investing 💼 #Charts 🖊️ #MarketTrends 📊
Bài đăng liên quan
Thông báo miễn trừ trách nhiệm
Thông tin và các ấn phẩm này không nhằm mục đích, và không cấu thành, lời khuyên hoặc khuyến nghị về tài chính, đầu tư, giao dịch hay các loại khác do TradingView cung cấp hoặc xác nhận. Đọc thêm tại Điều khoản Sử dụng.
Bài đăng liên quan
Thông báo miễn trừ trách nhiệm
Thông tin và các ấn phẩm này không nhằm mục đích, và không cấu thành, lời khuyên hoặc khuyến nghị về tài chính, đầu tư, giao dịch hay các loại khác do TradingView cung cấp hoặc xác nhận. Đọc thêm tại Điều khoản Sử dụng.