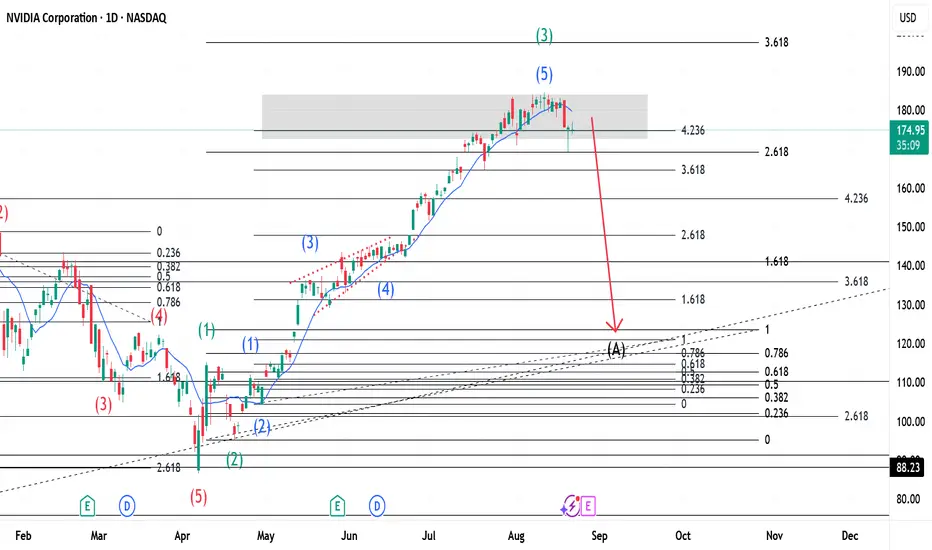
This is an update of a previous publication(link below). With price above the 423% Fib. level, this means that there is overbuying. Using Elliott Wave Theory we can see that Wave 3(Green) is complete with 5 waves(shown in Blue) inside it. What should follow from this is a Flat correction for Wave 4(Green) because Wave 2(Green) was a Zigzag. The Red arrow shows price direction only and points to a Wave A(Black) as our first wave for the Zigzag. This arrow does not show precise price ending rather shows direction. For more on the same, go to:

Thông báo miễn trừ trách nhiệm
Thông tin và ấn phẩm không có nghĩa là và không cấu thành, tài chính, đầu tư, kinh doanh, hoặc các loại lời khuyên hoặc khuyến nghị khác được cung cấp hoặc xác nhận bởi TradingView. Đọc thêm trong Điều khoản sử dụng.
Thông báo miễn trừ trách nhiệm
Thông tin và ấn phẩm không có nghĩa là và không cấu thành, tài chính, đầu tư, kinh doanh, hoặc các loại lời khuyên hoặc khuyến nghị khác được cung cấp hoặc xác nhận bởi TradingView. Đọc thêm trong Điều khoản sử dụng.