NVIDIA continues to trade with strong bullish momentum, consolidating just under the $190 level — a critical resistance area backed by prior liquidity grabs and gamma resistance. Today’s price action shows tight coiling between $188 and $189.50, indicating a potential breakout setup for the next session.
Market Structure:
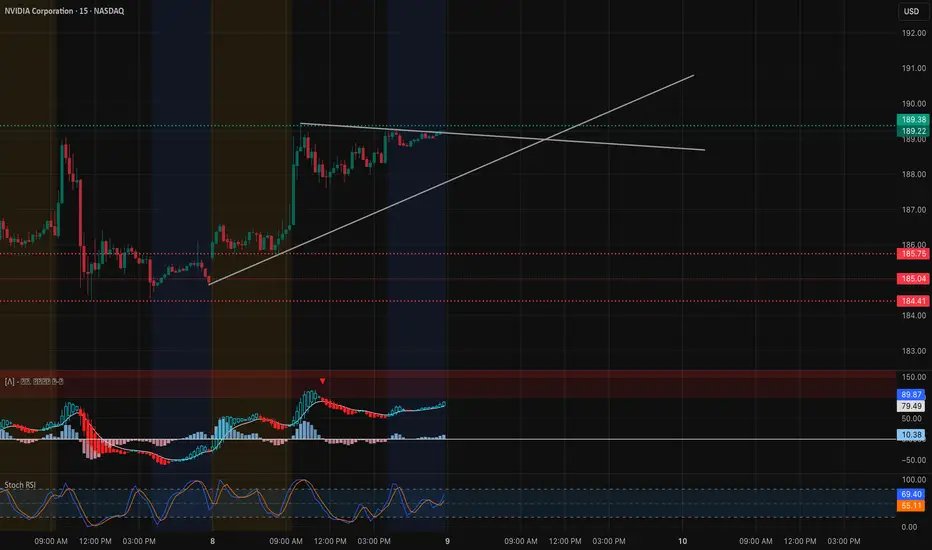
* On the 15-minute chart, NVDA is respecting an ascending trendline from yesterday’s low, suggesting sustained intraday bullish control.
* The 1-hour structure reveals a clean range between $185.75 (support) and $189.50 (resistance) — a breakout from this range could trigger a measured move toward $192–$195.
* MACD on the 15-minute is crossing bullish with rising histogram momentum, and the Stoch RSI remains elevated but not yet overextended — signaling possible continuation before cooling off.
Support and Resistance Levels:
* Immediate Resistance: $189.41 → $190.36 (short-term breakout zone)
* Major Resistance (Gamma Wall): $192.5 → $195
* Immediate Support: $186.89 → $185.75
* Key Support Zone: $184.4 → $182.8
GEX & Options Sentiment (1H GEX Chart):

* Highest positive Call Gamma concentration sits between $192.5 and $195, aligning with visible overhead resistance.
* Put support remains dense at $182–$180, forming a sturdy gamma floor.
* IVR remains low at 12.2, and call positioning slightly outweighs puts (13.5% call bias), showing traders are positioning bullish but cautiously.
* The GEX trend favors upside momentum while $185 holds, giving NVDA room to climb toward the $190–$192.5 zone if SPY continues to strengthen.
Trade Scenarios: Bullish Setup:
* Entry: Above $189.50 breakout confirmation
* Target 1: $192.5
* Target 2: $195
* Stop-Loss: Below $186.8
* Rationale: Trendline support, bullish MACD, and strong GEX alignment support a breakout continuation.
Bearish Setup:
* Entry: Below $185.75 (breakdown retest)
* Target 1: $184.4
* Target 2: $182
* Stop-Loss: Above $187
* Rationale: A rejection at $189–$190 with MACD divergence could trigger a short-term pullback to fill lower liquidity pockets.
NVDA’s price action shows controlled consolidation under a key resistance, suggesting a potential breakout continuation toward $192–$195 if momentum holds. Watch SPY’s direction for confirmation — any weakness there could cause NVDA to retest $185 before resuming upward. For now, bulls are in charge.
Disclaimer: This analysis is for educational purposes only and does not constitute financial advice. Always do your own research and manage your risk before trading.
Market Structure:
* On the 15-minute chart, NVDA is respecting an ascending trendline from yesterday’s low, suggesting sustained intraday bullish control.
* The 1-hour structure reveals a clean range between $185.75 (support) and $189.50 (resistance) — a breakout from this range could trigger a measured move toward $192–$195.
* MACD on the 15-minute is crossing bullish with rising histogram momentum, and the Stoch RSI remains elevated but not yet overextended — signaling possible continuation before cooling off.
Support and Resistance Levels:
* Immediate Resistance: $189.41 → $190.36 (short-term breakout zone)
* Major Resistance (Gamma Wall): $192.5 → $195
* Immediate Support: $186.89 → $185.75
* Key Support Zone: $184.4 → $182.8
GEX & Options Sentiment (1H GEX Chart):
* Highest positive Call Gamma concentration sits between $192.5 and $195, aligning with visible overhead resistance.
* Put support remains dense at $182–$180, forming a sturdy gamma floor.
* IVR remains low at 12.2, and call positioning slightly outweighs puts (13.5% call bias), showing traders are positioning bullish but cautiously.
* The GEX trend favors upside momentum while $185 holds, giving NVDA room to climb toward the $190–$192.5 zone if SPY continues to strengthen.
Trade Scenarios: Bullish Setup:
* Entry: Above $189.50 breakout confirmation
* Target 1: $192.5
* Target 2: $195
* Stop-Loss: Below $186.8
* Rationale: Trendline support, bullish MACD, and strong GEX alignment support a breakout continuation.
Bearish Setup:
* Entry: Below $185.75 (breakdown retest)
* Target 1: $184.4
* Target 2: $182
* Stop-Loss: Above $187
* Rationale: A rejection at $189–$190 with MACD divergence could trigger a short-term pullback to fill lower liquidity pockets.
NVDA’s price action shows controlled consolidation under a key resistance, suggesting a potential breakout continuation toward $192–$195 if momentum holds. Watch SPY’s direction for confirmation — any weakness there could cause NVDA to retest $185 before resuming upward. For now, bulls are in charge.
Disclaimer: This analysis is for educational purposes only and does not constitute financial advice. Always do your own research and manage your risk before trading.
Thông báo miễn trừ trách nhiệm
Thông tin và ấn phẩm không có nghĩa là và không cấu thành, tài chính, đầu tư, kinh doanh, hoặc các loại lời khuyên hoặc khuyến nghị khác được cung cấp hoặc xác nhận bởi TradingView. Đọc thêm trong Điều khoản sử dụng.
Thông báo miễn trừ trách nhiệm
Thông tin và ấn phẩm không có nghĩa là và không cấu thành, tài chính, đầu tư, kinh doanh, hoặc các loại lời khuyên hoặc khuyến nghị khác được cung cấp hoặc xác nhận bởi TradingView. Đọc thêm trong Điều khoản sử dụng.