https://www.tradingview.com/x/n2WCvjzC/
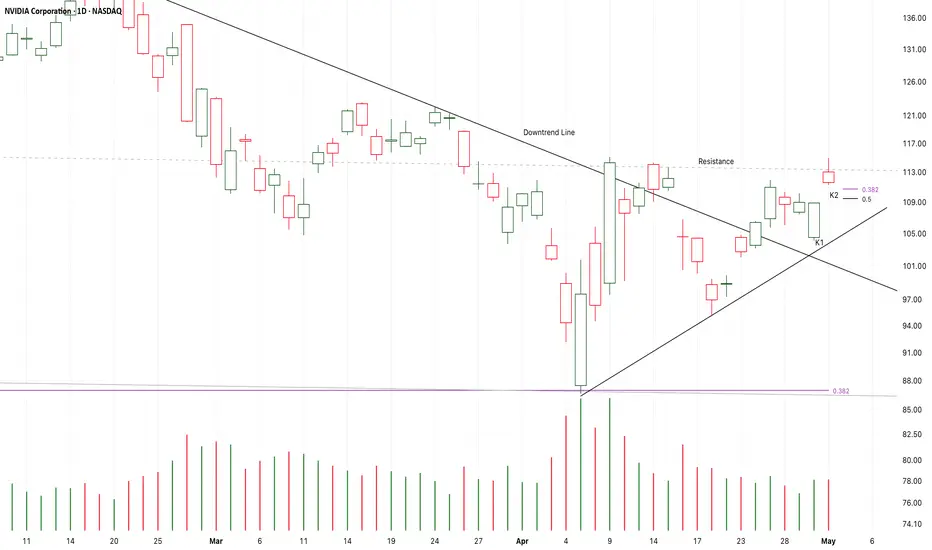
The recent several candles is a consolidation along the resistance.
And the supply pressure keeps at low level.
K1 is a bullish candle and it is also a potential right shoulder of a larger scale bullish head-shoulder pattern.
If the following candles close upon K2,
It is likely that another bull run will start here to test 125USD area.
On the other hand,
If K3 close below the bull gap at K2,
The risk will increase.
Long-110.5/Stop-109/Target-125
Ghi chú
After K1 break up the resistance for a second time,
K2 and K3 tested it under low supply pressure.
If K4 break up K2,
It will be a good place to buy it here.
On the other hand,
If K4 failed to close upon K2 or even break down K3,
The risk will sharply increase.
Long-116.65/Stop-115/Target-125
Ghi chú
K1 and K2 verified a potential strong support,
But, K2 still failed to close upon the resistance.
If K3 is a doji candle under sharply decreasing volume or sharply increasing supply pressure,
The resistance will be still effective.
On the other hand,
If K3 close upon the resistance,
Or, successfully fall to test 0.382-0.5fib area,
It is still valuable to buy it then.
Long-121/Target-195/Stop-113
Thông báo miễn trừ trách nhiệm
Thông tin và các ấn phẩm này không nhằm mục đích, và không cấu thành, lời khuyên hoặc khuyến nghị về tài chính, đầu tư, giao dịch hay các loại khác do TradingView cung cấp hoặc xác nhận. Đọc thêm tại Điều khoản Sử dụng.
Thông báo miễn trừ trách nhiệm
Thông tin và các ấn phẩm này không nhằm mục đích, và không cấu thành, lời khuyên hoặc khuyến nghị về tài chính, đầu tư, giao dịch hay các loại khác do TradingView cung cấp hoặc xác nhận. Đọc thêm tại Điều khoản Sử dụng.