Very simple chart...
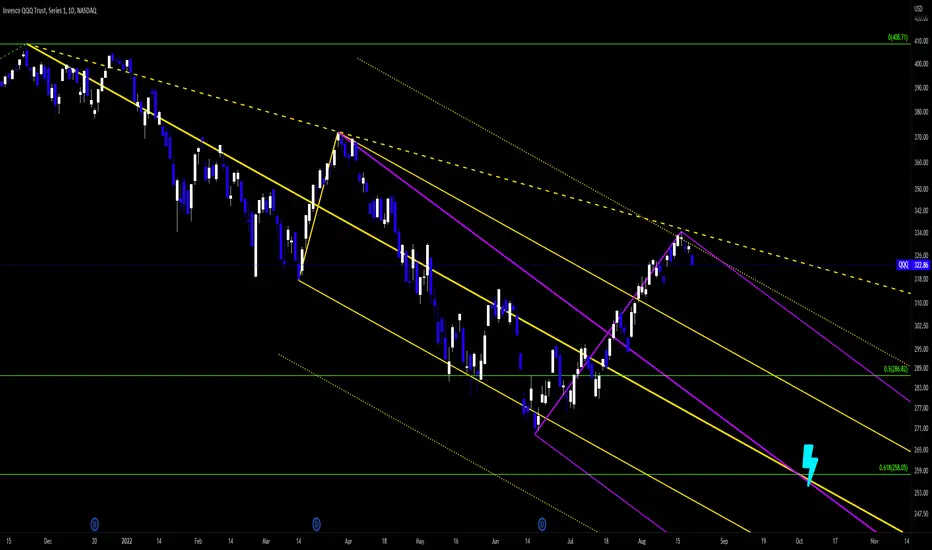
QQQ broke up out of the original fork (Yellow).
Price appears to be stalling out at the trigger line (Yellow-Dashed).
In addition, I plotted a warning line, using the 2.0 extension of the fork's median-line parallels to show another potential resistance area. (Yellow-Dotted)
Assuming that the Q's fail to sustain the rally past the trigger line/2.0 warning line; I've added another fork (purple) using the "C" pivot of the yellow fork as my origin point/"A" pivot, and the June low / August high as my "B" & "C" pivot.
I've noticed that the median lines of both forks cross to form what's known as an "Energy Point" right at the 0.618 fib level, aka $258 price level. (Measured from Covid Low to "Everything Bubble" high)
Energy Points pull price towards them like a magnet.
This Energy Point appears to take place between September 27th - October 4th.
I'm expecting the QQQ to fall at/near this energy point by early October.
Fat_Fat
Ghi chú
Full View of the Fib Retracement
Ghi chú
I don't know why the .618 is not visible in the snapshot... If you click the image you'll see it.Ghi chú
Took profits on most of my puts today. Roughly 75% of the trade.Ghi chú
Closed Trade in full today $$$$$Thông báo miễn trừ trách nhiệm
Thông tin và ấn phẩm không có nghĩa là và không cấu thành, tài chính, đầu tư, kinh doanh, hoặc các loại lời khuyên hoặc khuyến nghị khác được cung cấp hoặc xác nhận bởi TradingView. Đọc thêm trong Điều khoản sử dụng.
Thông báo miễn trừ trách nhiệm
Thông tin và ấn phẩm không có nghĩa là và không cấu thành, tài chính, đầu tư, kinh doanh, hoặc các loại lời khuyên hoặc khuyến nghị khác được cung cấp hoặc xác nhận bởi TradingView. Đọc thêm trong Điều khoản sử dụng.