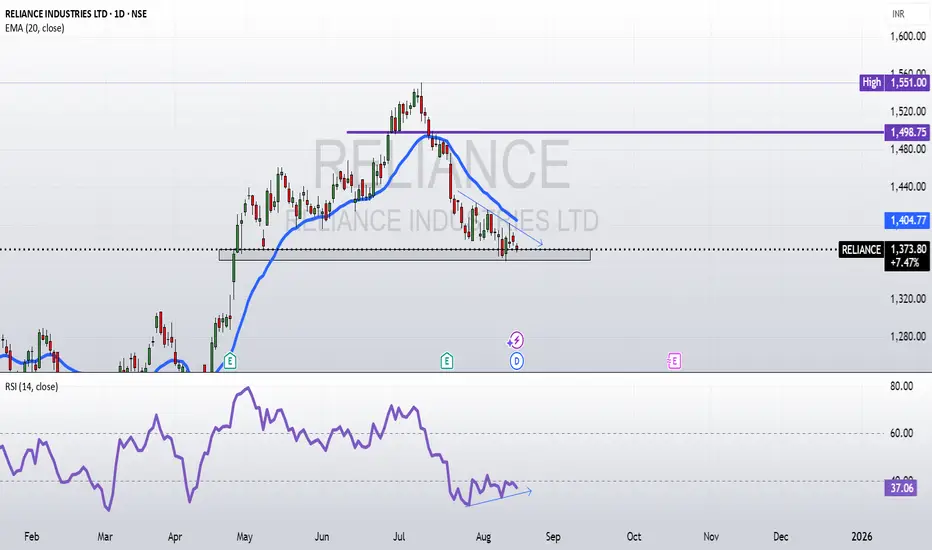
there is bullish divergence you see on the chart with respect to RSI. and EMA20 acts a resistance/support in the daily timeframe.
Breakout: 1400
Target 1: 1426
Target 2: 1460
Target 3: 1498
Disclaimer:
I am NOT a SEBI registered advisor nor a financial advisor.
Any investments or trades I discuss on my blog are intended solely for educational purposes and do not represent specific financial, trading, or investment advice.
Disclosure:
I, the author of this report, and my immediate family members do not have any financial interest or beneficial ownership in the securities mentioned herein at the time of publication.
Thông báo miễn trừ trách nhiệm
Thông tin và ấn phẩm không có nghĩa là và không cấu thành, tài chính, đầu tư, kinh doanh, hoặc các loại lời khuyên hoặc khuyến nghị khác được cung cấp hoặc xác nhận bởi TradingView. Đọc thêm trong Điều khoản sử dụng.
Thông báo miễn trừ trách nhiệm
Thông tin và ấn phẩm không có nghĩa là và không cấu thành, tài chính, đầu tư, kinh doanh, hoặc các loại lời khuyên hoặc khuyến nghị khác được cung cấp hoặc xác nhận bởi TradingView. Đọc thêm trong Điều khoản sử dụng.