📊 Weekly Technical Outlook
Overall Trend: The prevailing trend is bearish, with a "Strong Sell" signal on the weekly timeframe.
Moving Averages: All key moving averages—5-day, 10-day, 20-day, 50-day, 100-day, and 200-day—are indicating a "Sell" signal.
Relative Strength Index (RSI): The RSI is at 44.99, suggesting the stock is neither overbought nor oversold but leans towards a bearish stance.
MACD: The Moving Average Convergence Divergence (MACD) is positive at 1.73, indicating potential upward momentum.
🔧 Key Support & Resistance Levels
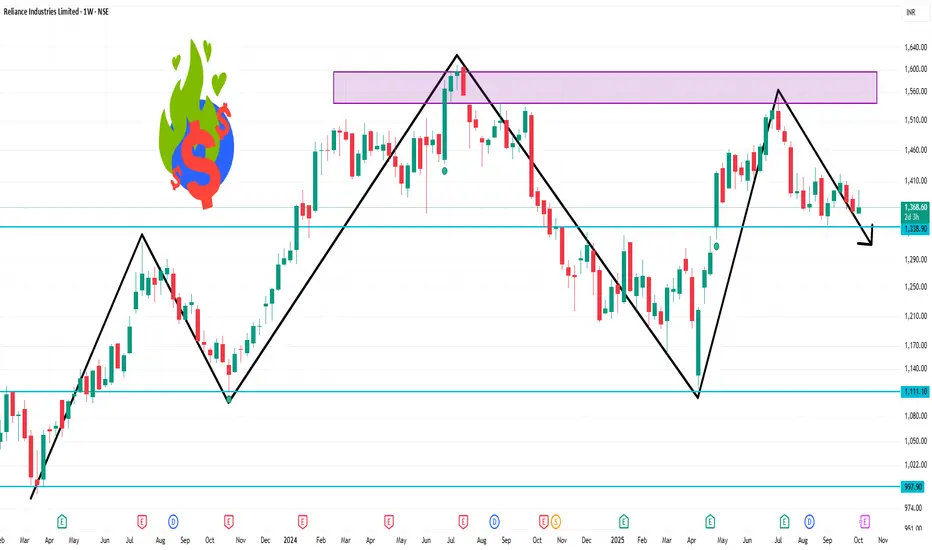
Weekly Pivot Point: ₹1,369.77
Support Levels: ₹1,318.43, ₹1,337.67
Resistance Levels: ₹1,401.87, ₹1,414.73
🔍 Additional Indicators
Technical Summary: The stock is rated as a "Strong Sell" based on moving averages and technical indicators.
Pivot Analysis: Current price is trading below the weekly pivot point, indicating a bearish short-term outlook.
📈 Conclusion
Reliance Industries Ltd is currently in a bearish phase on the weekly chart, with all major moving averages signaling a "Sell." While the MACD suggests some potential for upward movement, the overall technical indicators and pivot analysis point towards caution. Traders should monitor the support levels closely; a break below ₹1,318.43 could lead to further downside.
Overall Trend: The prevailing trend is bearish, with a "Strong Sell" signal on the weekly timeframe.
Moving Averages: All key moving averages—5-day, 10-day, 20-day, 50-day, 100-day, and 200-day—are indicating a "Sell" signal.
Relative Strength Index (RSI): The RSI is at 44.99, suggesting the stock is neither overbought nor oversold but leans towards a bearish stance.
MACD: The Moving Average Convergence Divergence (MACD) is positive at 1.73, indicating potential upward momentum.
🔧 Key Support & Resistance Levels
Weekly Pivot Point: ₹1,369.77
Support Levels: ₹1,318.43, ₹1,337.67
Resistance Levels: ₹1,401.87, ₹1,414.73
🔍 Additional Indicators
Technical Summary: The stock is rated as a "Strong Sell" based on moving averages and technical indicators.
Pivot Analysis: Current price is trading below the weekly pivot point, indicating a bearish short-term outlook.
📈 Conclusion
Reliance Industries Ltd is currently in a bearish phase on the weekly chart, with all major moving averages signaling a "Sell." While the MACD suggests some potential for upward movement, the overall technical indicators and pivot analysis point towards caution. Traders should monitor the support levels closely; a break below ₹1,318.43 could lead to further downside.
Bài đăng liên quan
Thông báo miễn trừ trách nhiệm
Thông tin và các ấn phẩm này không nhằm mục đích, và không cấu thành, lời khuyên hoặc khuyến nghị về tài chính, đầu tư, giao dịch hay các loại khác do TradingView cung cấp hoặc xác nhận. Đọc thêm tại Điều khoản Sử dụng.
Bài đăng liên quan
Thông báo miễn trừ trách nhiệm
Thông tin và các ấn phẩm này không nhằm mục đích, và không cấu thành, lời khuyên hoặc khuyến nghị về tài chính, đầu tư, giao dịch hay các loại khác do TradingView cung cấp hoặc xác nhận. Đọc thêm tại Điều khoản Sử dụng.