Introduction:
This analysis focuses on the daily chart of Reliance Industries (RIL), highlighting critical supply and demand zones that are likely to dictate its price action in the coming weeks and months. We observe a recent uptrend followed by a pullback, and the current price action is situated at crucial junctures.
Key Observations & Zones:
Daily Latest Supply Order Block (Resistance):
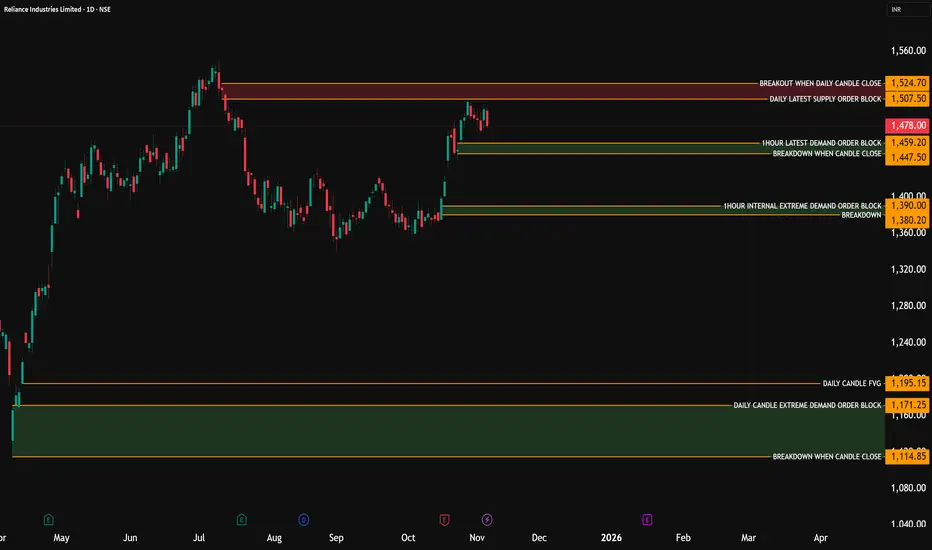
Zone: 1,507.50 - 1,524.70 (highlighted in red)
Significance: This is a formidable resistance area. A daily candle closing above 1,524.70 would signal a strong bullish breakout, potentially targeting higher price levels. Until then, this zone acts as a ceiling, where sellers have historically stepped in. We've seen a recent rejection from this area, confirming its strength.
1-Hour Latest Demand Order Block (Immediate Support):
Zone: 1,447.50 - 1,459.20 (highlighted in yellow)
Significance: This is the immediate support zone identified from a lower timeframe (1-hour chart). For bulls to maintain control in the short term, RIL needs to hold above 1,447.50. A breakdown below this level could trigger further downside pressure.
1-Hour Internal Extreme Demand Order Block (Strong Support):
Zone: 1,360.00 - 1,390.00 (highlighted in green)
Significance: This represents a much stronger demand zone, likely to attract significant buying interest if the price reaches it. This is a key area for potential reversals or strong bounces. A breakdown below 1,360.00 would be a significant bearish development, suggesting a deeper correction.
Daily Candle Extreme Demand Order Block (Long-Term Support):
Zone: 1,160.00 - 1,195.15 (highlighted in a broader green box)
Significance: This is a crucial long-term demand zone. If RIL experiences a substantial correction, this area is expected to provide very strong support. A daily candle close below 1,114.85 (the lowest yellow line beneath this zone) would invalidate this demand and indicate a major shift in the long-term trend.
Current Price Action & Outlook:
RIL is currently trading within the proximity of the 1-hour latest demand order block. The stock is attempting to find support here after being rejected from the daily supply zone.
Potential Scenarios:
Bullish Scenario: A strong bounce from the current levels or the 1-hour internal extreme demand order block (1,360-1,390), followed by a decisive daily close above 1,524.70, would confirm renewed bullish momentum.
Bearish Scenario: A daily close below 1,447.50 could lead to a test of the 1-hour internal extreme demand order block. A breakdown below 1,360.00 would open the doors for a deeper correction towards the long-term daily candle extreme demand order block.
Conclusion:
RIL is at a critical juncture. Traders should closely monitor how the price reacts to these identified supply and demand zones. The levels of 1,524.70 on the upside and 1,447.50 (short-term) / 1,360.00 (medium-term) on the downside will be pivotal in determining its near to medium-term trajectory.
This analysis focuses on the daily chart of Reliance Industries (RIL), highlighting critical supply and demand zones that are likely to dictate its price action in the coming weeks and months. We observe a recent uptrend followed by a pullback, and the current price action is situated at crucial junctures.
Key Observations & Zones:
Daily Latest Supply Order Block (Resistance):
Zone: 1,507.50 - 1,524.70 (highlighted in red)
Significance: This is a formidable resistance area. A daily candle closing above 1,524.70 would signal a strong bullish breakout, potentially targeting higher price levels. Until then, this zone acts as a ceiling, where sellers have historically stepped in. We've seen a recent rejection from this area, confirming its strength.
1-Hour Latest Demand Order Block (Immediate Support):
Zone: 1,447.50 - 1,459.20 (highlighted in yellow)
Significance: This is the immediate support zone identified from a lower timeframe (1-hour chart). For bulls to maintain control in the short term, RIL needs to hold above 1,447.50. A breakdown below this level could trigger further downside pressure.
1-Hour Internal Extreme Demand Order Block (Strong Support):
Zone: 1,360.00 - 1,390.00 (highlighted in green)
Significance: This represents a much stronger demand zone, likely to attract significant buying interest if the price reaches it. This is a key area for potential reversals or strong bounces. A breakdown below 1,360.00 would be a significant bearish development, suggesting a deeper correction.
Daily Candle Extreme Demand Order Block (Long-Term Support):
Zone: 1,160.00 - 1,195.15 (highlighted in a broader green box)
Significance: This is a crucial long-term demand zone. If RIL experiences a substantial correction, this area is expected to provide very strong support. A daily candle close below 1,114.85 (the lowest yellow line beneath this zone) would invalidate this demand and indicate a major shift in the long-term trend.
Current Price Action & Outlook:
RIL is currently trading within the proximity of the 1-hour latest demand order block. The stock is attempting to find support here after being rejected from the daily supply zone.
Potential Scenarios:
Bullish Scenario: A strong bounce from the current levels or the 1-hour internal extreme demand order block (1,360-1,390), followed by a decisive daily close above 1,524.70, would confirm renewed bullish momentum.
Bearish Scenario: A daily close below 1,447.50 could lead to a test of the 1-hour internal extreme demand order block. A breakdown below 1,360.00 would open the doors for a deeper correction towards the long-term daily candle extreme demand order block.
Conclusion:
RIL is at a critical juncture. Traders should closely monitor how the price reacts to these identified supply and demand zones. The levels of 1,524.70 on the upside and 1,447.50 (short-term) / 1,360.00 (medium-term) on the downside will be pivotal in determining its near to medium-term trajectory.
Thông báo miễn trừ trách nhiệm
Thông tin và các ấn phẩm này không nhằm mục đích, và không cấu thành, lời khuyên hoặc khuyến nghị về tài chính, đầu tư, giao dịch hay các loại khác do TradingView cung cấp hoặc xác nhận. Đọc thêm tại Điều khoản Sử dụng.
Thông báo miễn trừ trách nhiệm
Thông tin và các ấn phẩm này không nhằm mục đích, và không cấu thành, lời khuyên hoặc khuyến nghị về tài chính, đầu tư, giao dịch hay các loại khác do TradingView cung cấp hoặc xác nhận. Đọc thêm tại Điều khoản Sử dụng.