📈 Technical Analysis:
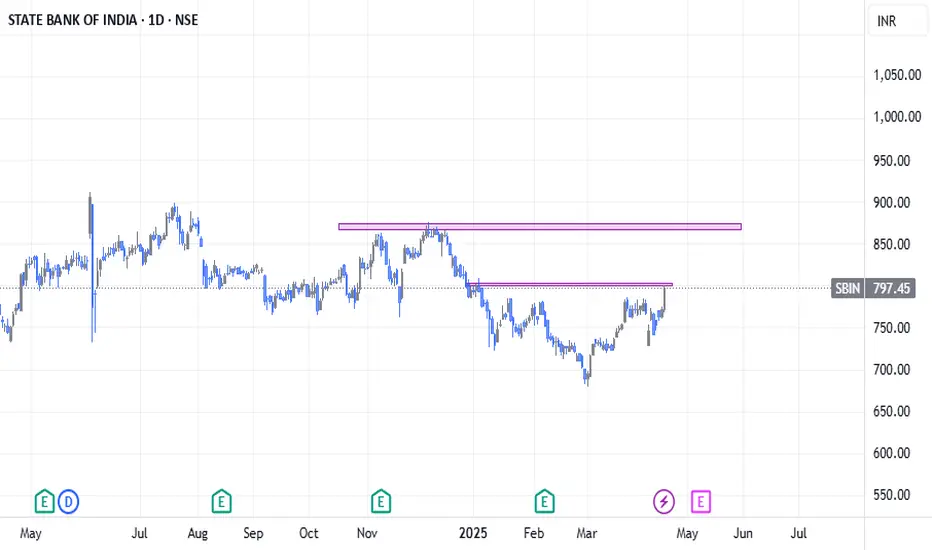
Strong breakout seen on the daily chart after price moved above a key neckline zone, signaling potential trend reversal.
Price has also closed above the 200-day moving average (200 MA) on the daily timeframe – a strong bullish indicator.
On the weekly chart, there's noticeable buying momentum, with a breakout above the 50-week moving average (50 MA), confirming strength on a higher timeframe.
📊 Overall View:
Multiple bullish confirmations across daily and weekly charts suggest further upside potential.
A successful of the breakout zone could lead to strong upward continuation.
✅ Bias: Bullish
🔎 Watch Levels:
Support: Breakout zone / 200 MA
Resistance: Previous swing highs
🚫 Disclaimer: This is not financial advice. Please do your own research and consult your financial advisor before making any investment decisions.
Đóng lệnh: đạt mục tiêu
Thông báo miễn trừ trách nhiệm
Thông tin và ấn phẩm không có nghĩa là và không cấu thành, tài chính, đầu tư, kinh doanh, hoặc các loại lời khuyên hoặc khuyến nghị khác được cung cấp hoặc xác nhận bởi TradingView. Đọc thêm trong Điều khoản sử dụng.
Thông báo miễn trừ trách nhiệm
Thông tin và ấn phẩm không có nghĩa là và không cấu thành, tài chính, đầu tư, kinh doanh, hoặc các loại lời khuyên hoặc khuyến nghị khác được cung cấp hoặc xác nhận bởi TradingView. Đọc thêm trong Điều khoản sử dụng.