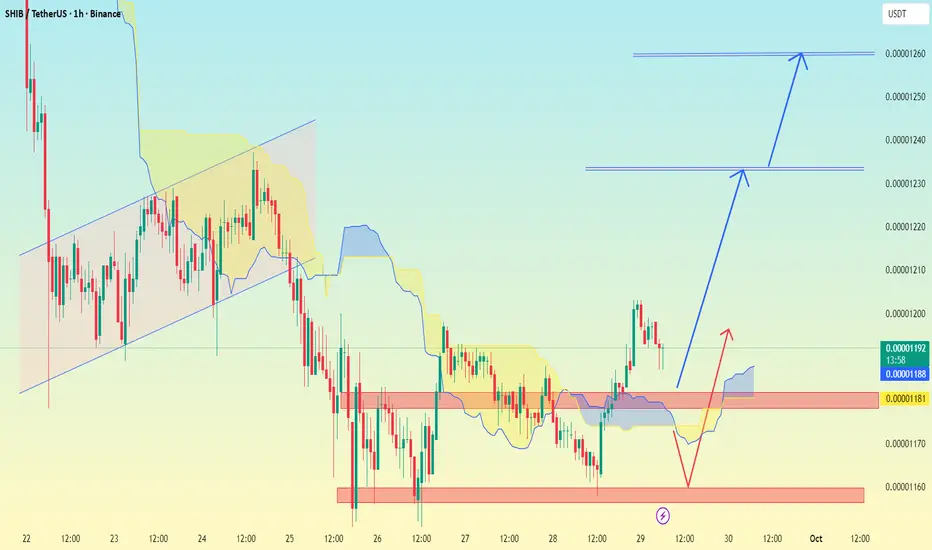
SHIB/USDT 1H chart, I see already marked possible targets with blue arrows. Based on the chart structure:
Immediate support zone: around 0.00001180 – 0.00001188 (red box).
Upside potential:
First target (short-term): 0.00001230
Second target (next level): 0.00001260
So the expected move is:
If SHIB holds above 0.00001180, bullish momentum can push it first to 0.00001230, and if that breaks, then toward 0.00001260.
If it breaks below 0.00001180, price could retest the lower support zone near 0.00001160.
📌 Summary:
Bullish target 1 → 0.00001230
Bullish target 2 → 0.00001260
Support to watch → 0.00001180 / 0.00001160
Giao dịch đang hoạt động
trade activet.me/RSI_Trading_Point4
Forex, gold and crypto signal's with detailed analysis & get consistent results..
t.me/forexofdollarsmagnet
Gold signal's with proper TP & SL for high profits opportunities..
Forex, gold and crypto signal's with detailed analysis & get consistent results..
t.me/forexofdollarsmagnet
Gold signal's with proper TP & SL for high profits opportunities..
Bài đăng liên quan
Thông báo miễn trừ trách nhiệm
Thông tin và ấn phẩm không có nghĩa là và không cấu thành, tài chính, đầu tư, kinh doanh, hoặc các loại lời khuyên hoặc khuyến nghị khác được cung cấp hoặc xác nhận bởi TradingView. Đọc thêm trong Điều khoản sử dụng.
t.me/RSI_Trading_Point4
Forex, gold and crypto signal's with detailed analysis & get consistent results..
t.me/forexofdollarsmagnet
Gold signal's with proper TP & SL for high profits opportunities..
Forex, gold and crypto signal's with detailed analysis & get consistent results..
t.me/forexofdollarsmagnet
Gold signal's with proper TP & SL for high profits opportunities..
Bài đăng liên quan
Thông báo miễn trừ trách nhiệm
Thông tin và ấn phẩm không có nghĩa là và không cấu thành, tài chính, đầu tư, kinh doanh, hoặc các loại lời khuyên hoặc khuyến nghị khác được cung cấp hoặc xác nhận bởi TradingView. Đọc thêm trong Điều khoản sử dụng.