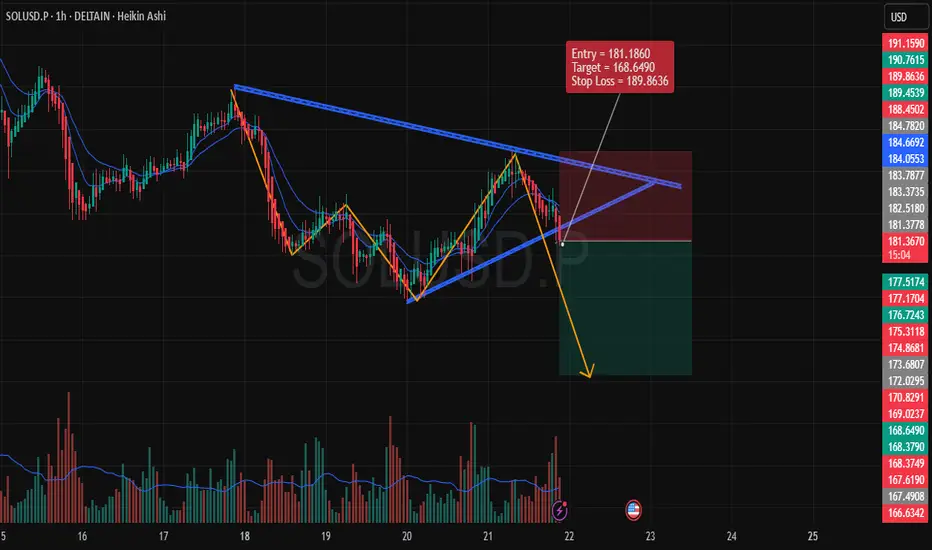
Entry Price: 181.1860
Target: 168.6490
Stop Loss (SL): 189.8636
1. Chart Analysis
We are observing a descending triangle pattern formation, which generally signals a bearish continuation once the price breaks downward.
The price action has already shown signs of rejection at the upper boundary of the pattern, reinforcing the possibility of a breakout to the downside.
2. Indicators & Confirmation
Volume Analysis: Noticeable spike in volume during the recent downward movement, which indicates strong selling pressure. This is crucial for confirming the potential bearish trend.
EMA Confluence: The price is below the 9 and 20 EMAs, which are crucial indicators of the current market trend. The EMAs are acting as dynamic resistance, further supporting the bearish scenario.
3. Risk Management
The stop loss is placed above the most recent significant high at 189.8636. This placement ensures that we protect against any false breakouts or short-term price reversals.
The target at 168.6490 is derived based on previous support levels and a measured move from the triangle pattern. This target is realistic given the market structure.
4. Price Action
The price action shows lower highs and lower lows, a typical characteristic of a downtrend. If this pattern holds, the next logical price move is to break downward through the support of the triangle.
5. Conclusion
Overall, this setup provides a solid bearish opportunity, backed by technical patterns and strong momentum indicators. The risk-to-reward ratio is favorable, making it a well-structured trade.
Đóng lệnh: dừng lỗ
SL DUE TO FOMC Thông báo miễn trừ trách nhiệm
Thông tin và ấn phẩm không có nghĩa là và không cấu thành, tài chính, đầu tư, kinh doanh, hoặc các loại lời khuyên hoặc khuyến nghị khác được cung cấp hoặc xác nhận bởi TradingView. Đọc thêm trong Điều khoản sử dụng.
Thông báo miễn trừ trách nhiệm
Thông tin và ấn phẩm không có nghĩa là và không cấu thành, tài chính, đầu tư, kinh doanh, hoặc các loại lời khuyên hoặc khuyến nghị khác được cung cấp hoặc xác nhận bởi TradingView. Đọc thêm trong Điều khoản sử dụng.