There are multiple ways to approach position sizing. The most suitable method depends on the trader’s objectives, timeframe, and account structure. For example, a long-term investor managing a portfolio will operate differently than a short-term trader running a high-frequency system. This chapter will not attempt to cover all possible methods, but will focus on the framework most relevant to the active trader.
Equalized Risk
The most practical method for position sizing is known as equalized risk per trade. This model ensures that each trade risks the same monetary amount, regardless of the stop loss distance. The position size will be calculated based on the distance between the entry price and the stop loss, which means a closer stop equals more size, where a wider stop equals less size. This allows for a more structured and consistent risk control across various events.
For example, an account size of $100,000 and risk amount of 1% will be equivalent to $1,000. In the scenario of a $100 stock price, the table below provides a visual representation of how the position size adapts to different stop loss placements, to maintain an equalized risk per trade. This process can be integrated into order execution on some trading platforms.

The amount risked per trade should be based on a fixed percentage of the current account size. As the account grows, the dollar amount risked increases, allowing for compounding. If the account shrinks, the dollar risk decreases, which helps reduce the impact of continued losses. This approach smooths out the effect of random sequences. A percentage-based model limits downside exposure while preserving upside potential.
To better illustrate how position sizing affects long-term outcomes, a controlled simulation was conducted. The experiment modeled a system with a 50% win rate and a 1.1 to 1 average reward-to-risk ratio. Starting with a $50,000 account, the system executed 500 trades across 1000 separate runs. Two position sizing methods were compared: a fixed dollar risk of $1000 per trade and a dynamic model risking 2% of the current account balance.
Fixed-Risk Model

In the fixed-risk model, position size remained constant throughout the simulation. The final outcomes formed a relatively tight, symmetrical distribution centered around the expected value, which corresponds to consistent variance.
Dynamic-Risk Model

The dynamic-risk model produced a wider and more skewed distribution. Profitable runs experienced accelerated increase through compounding, while losing runs saw smaller drawdowns due to self-limiting trade size. Although dynamic risk introduces greater dispersion in final outcomes, it allows scalable growth over time. This compounding effect is what makes a dynamic model effective for achieving exponential returns.
A common question is what percentage to use. A range between 1–3% of the account is generally considered reasonable. Too much risk per trade can quickly become destructive, consider that even profitable systems may experience a streak of losses. For instance, a series of five consecutive losses at 10% risk per trade would cut the account by roughly 41%, requiring over a 70% return to recover. In case catastrophic events occur; large position sizing makes them irreversible. However, keeping position size and risk too small can make the entire effort unproductive. There is no such thing as a free trade, meaningful reward requires exposure to risk.
Risk Definition and Stop Placement
Risk in trading represents uncertainty in both the direction and magnitude of outcomes. It can be thought of as the potential result of an event, multiplied by the likelihood of that event occurring. This concept can be formulated as:
This challenges a common assumption that using a closer stop placement equals reduced risk. This is a common misconception. A tighter stop increases the chance of being triggered by normal price fluctuations, which can result in a higher frequency of losses even when the trade idea is valid.
Wide stop placements reduce the likelihood of premature exit, but they also require price to travel further to reach the target, which can slow down the trade and distort the reward-to-risk profile. An effective stop should reflect the volatility of the instrument while remaining consistent with the structure of the setup. A practical guideline is to place stops within 1–3 times the ATR, which allows room for price movement without compromising the reward-risk profile.
When a stop is defined, the distance from entry to stop becomes the risk unit, commonly referred to as R. A target placed at the same distance above the entry is considered 1R, while a target twice as far is 2R, and so on. Thinking in terms of R-multiples standardizes evaluation across different instruments and account sizes. It also helps track expectancy, maintain consistency, and compare trading performance.
In summary, risk is best understood as uncertainty, where the outcome is shaped by both the possible result and the probability of it occurring. The preferred approach for the active trader is equalized risk per trade, where a consistent percentage of the account, typically 1–3%, is risked on each position regardless of the stop distance. This allows the account to develop through compounding. It also reinforces the importance of thinking in terms of sample size. Individual trades are random, but consistent risk control allows statistical edge to develop over time.
Practical Application
To simplify this process, the Risk Module has been developed. The indicator provides a visual reference for position sizing, stop placement, and target definition directly on the chart. It calculates equalized risk per trade and helps maintain consistent exposure.
Equalized Risk
The most practical method for position sizing is known as equalized risk per trade. This model ensures that each trade risks the same monetary amount, regardless of the stop loss distance. The position size will be calculated based on the distance between the entry price and the stop loss, which means a closer stop equals more size, where a wider stop equals less size. This allows for a more structured and consistent risk control across various events.
Position Size = Dollar Risk / (Entry Price − Stop Price)
Position Size = Dollar Risk / (Entry Price × Stop in %)
For example, an account size of $100,000 and risk amount of 1% will be equivalent to $1,000. In the scenario of a $100 stock price, the table below provides a visual representation of how the position size adapts to different stop loss placements, to maintain an equalized risk per trade. This process can be integrated into order execution on some trading platforms.
The amount risked per trade should be based on a fixed percentage of the current account size. As the account grows, the dollar amount risked increases, allowing for compounding. If the account shrinks, the dollar risk decreases, which helps reduce the impact of continued losses. This approach smooths out the effect of random sequences. A percentage-based model limits downside exposure while preserving upside potential.
To better illustrate how position sizing affects long-term outcomes, a controlled simulation was conducted. The experiment modeled a system with a 50% win rate and a 1.1 to 1 average reward-to-risk ratio. Starting with a $50,000 account, the system executed 500 trades across 1000 separate runs. Two position sizing methods were compared: a fixed dollar risk of $1000 per trade and a dynamic model risking 2% of the current account balance.
Fixed-Risk Model
In the fixed-risk model, position size remained constant throughout the simulation. The final outcomes formed a relatively tight, symmetrical distribution centered around the expected value, which corresponds to consistent variance.
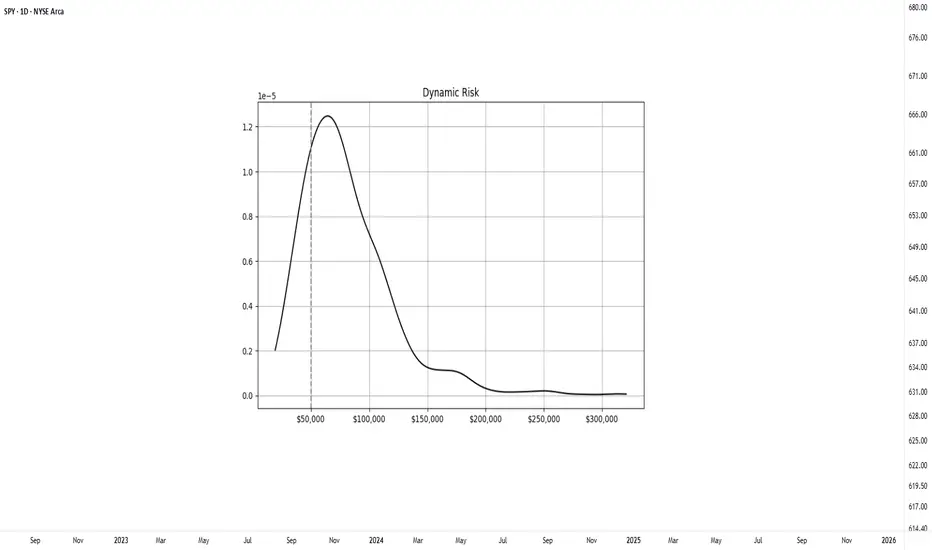
Dynamic-Risk Model
The dynamic-risk model produced a wider and more skewed distribution. Profitable runs experienced accelerated increase through compounding, while losing runs saw smaller drawdowns due to self-limiting trade size. Although dynamic risk introduces greater dispersion in final outcomes, it allows scalable growth over time. This compounding effect is what makes a dynamic model effective for achieving exponential returns.
A common question is what percentage to use. A range between 1–3% of the account is generally considered reasonable. Too much risk per trade can quickly become destructive, consider that even profitable systems may experience a streak of losses. For instance, a series of five consecutive losses at 10% risk per trade would cut the account by roughly 41%, requiring over a 70% return to recover. In case catastrophic events occur; large position sizing makes them irreversible. However, keeping position size and risk too small can make the entire effort unproductive. There is no such thing as a free trade, meaningful reward requires exposure to risk.
Risk Definition and Stop Placement
Risk in trading represents uncertainty in both the direction and magnitude of outcomes. It can be thought of as the potential result of an event, multiplied by the likelihood of that event occurring. This concept can be formulated as:
Risk = Outcome × Probability of Outcome
This challenges a common assumption that using a closer stop placement equals reduced risk. This is a common misconception. A tighter stop increases the chance of being triggered by normal price fluctuations, which can result in a higher frequency of losses even when the trade idea is valid.
Wide stop placements reduce the likelihood of premature exit, but they also require price to travel further to reach the target, which can slow down the trade and distort the reward-to-risk profile. An effective stop should reflect the volatility of the instrument while remaining consistent with the structure of the setup. A practical guideline is to place stops within 1–3 times the ATR, which allows room for price movement without compromising the reward-risk profile.
When a stop is defined, the distance from entry to stop becomes the risk unit, commonly referred to as R. A target placed at the same distance above the entry is considered 1R, while a target twice as far is 2R, and so on. Thinking in terms of R-multiples standardizes evaluation across different instruments and account sizes. It also helps track expectancy, maintain consistency, and compare trading performance.
In summary, risk is best understood as uncertainty, where the outcome is shaped by both the possible result and the probability of it occurring. The preferred approach for the active trader is equalized risk per trade, where a consistent percentage of the account, typically 1–3%, is risked on each position regardless of the stop distance. This allows the account to develop through compounding. It also reinforces the importance of thinking in terms of sample size. Individual trades are random, but consistent risk control allows statistical edge to develop over time.
Practical Application
To simplify this process, the Risk Module has been developed. The indicator provides a visual reference for position sizing, stop placement, and target definition directly on the chart. It calculates equalized risk per trade and helps maintain consistent exposure.
Technical Trading: Research and Application
stockleave.com/
stockleave.com/
Bài đăng liên quan
Thông báo miễn trừ trách nhiệm
Thông tin và các ấn phẩm này không nhằm mục đích, và không cấu thành, lời khuyên hoặc khuyến nghị về tài chính, đầu tư, giao dịch hay các loại khác do TradingView cung cấp hoặc xác nhận. Đọc thêm tại Điều khoản Sử dụng.