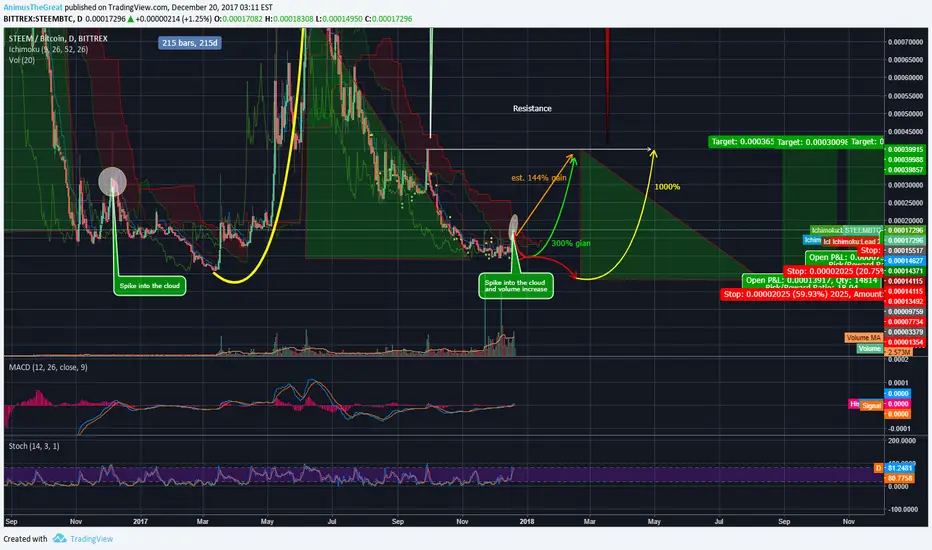
On the daily chart we can suspect that history will repeat itself.
Triangles marked and the downtrend produce similar pattern except in smaller scale where the breakout in the downtrend represents the resistance (top of the next triangle). Also break out into the bearish cloud are similar compared between first two triangles marked down.
This can possible indicate a trend throughout history of what is coming up in the mid-term (assumption).
Taking that into consideration potential gain of:
1000% (Yellow arrow) is most possible followed by
273% gain (Green arrow) and
144% (Orange arrow) if we see bounce out of the cloud
Lets see what the third season of the serious will bring up.
regards
Animus the Great
Giao dịch đang hoạt động
Target reached... still room to grow! update chart coming soon
Thông báo miễn trừ trách nhiệm
Thông tin và ấn phẩm không có nghĩa là và không cấu thành, tài chính, đầu tư, kinh doanh, hoặc các loại lời khuyên hoặc khuyến nghị khác được cung cấp hoặc xác nhận bởi TradingView. Đọc thêm trong Điều khoản sử dụng.
Thông báo miễn trừ trách nhiệm
Thông tin và ấn phẩm không có nghĩa là và không cấu thành, tài chính, đầu tư, kinh doanh, hoặc các loại lời khuyên hoặc khuyến nghị khác được cung cấp hoặc xác nhận bởi TradingView. Đọc thêm trong Điều khoản sử dụng.